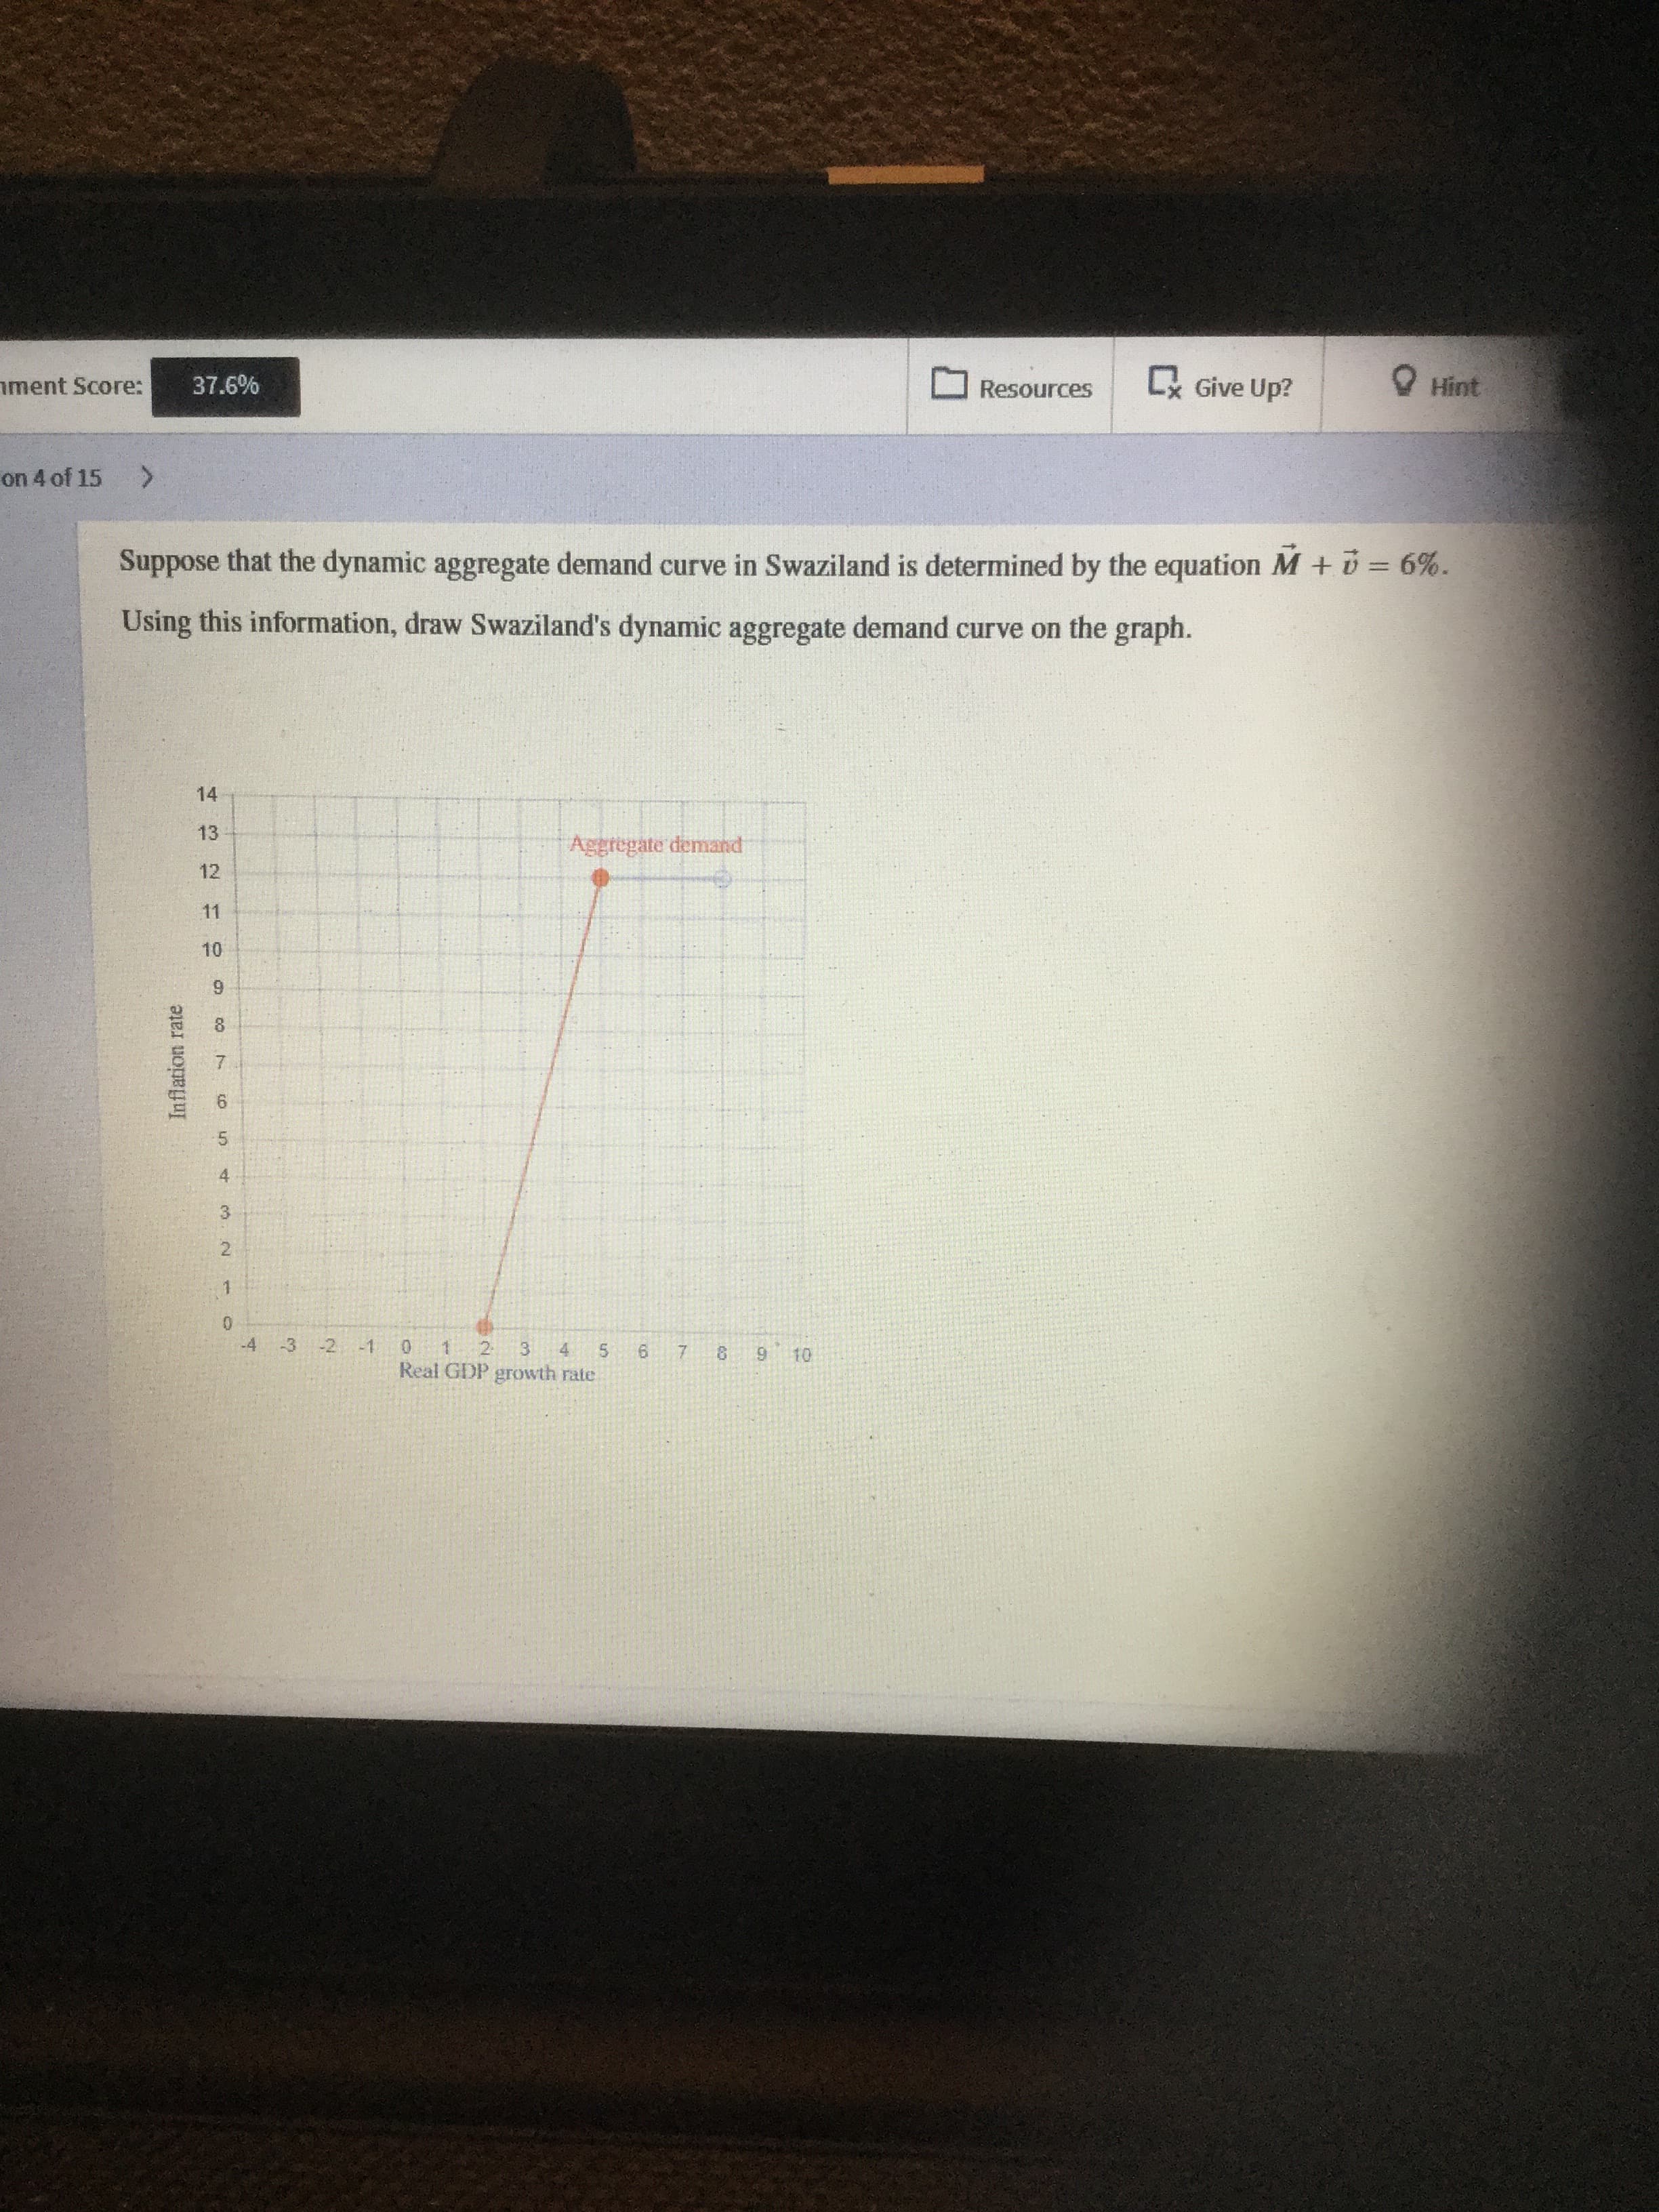
ament Score: 37.6% Resources Lx Give Up? Hint on 4 of 15 <. Suppose that the dynamic aggregate demand curve in Swaziland is determined by the equation M+ D= 6%. Using this information, draw Swaziland's dynamic aggregate demand curve on the graph. 13 Aggregate demand 12 11 10 8. 9. 4. 1. -3 -2 -1 0. 2. 3. Real GDP growth rate 5. 6. 10 4. 4. 7. 14 Inflation rate


Q: Suppose firms become very optimistic about future business conditions and invest heavily in new…
A: Aggregate supply: It is the total inventory of merchandise and enterprises that organizations in a…
Q: Assuming Aggregate Demand and Aggregate Supply are initially at ADo and ASo respectively, which of…
A: The aggregate demand curve shows the total demand for all the finished goods and services in an…
Q: Assume that the stock market increases by 5% this month. As a result Question 6 options: a) the…
A: A stock market rise increases the overall confidence of the people, and the economy increases. There…
Q: Moving to another question will save this response. Question 24 A leftward shift in aggregate supply…
A: A leftward shift in AS that is a result of decrease in aggregate supply.
Q: Which of he following statements accurately explain the scenario illustrated by these diagrams?…
A: A is true as the original demand is ADo and original expenditure is AEo, the inflationary gap is of…
Q: Consider the aggregate supply-aggregate demand (AD-AS) model that we saw in class. Assume that…
A: Long run refers to a period of time where all cost and factors of production become variable.All…
Q: Suppose firms become very optimistic about future business conditions and invest heavily in new…
A: The aggregate demand curve shows the negative relationship between price level and real GDP where…
Q: Multiple choice. 3. Which of the following statements is true if there is an increase in aggregate…
A: increase in aggregate demand while the economy is in equilibrium on a positively sloping short-run…
Q: q7
A: Income is either saved or consumed. If households have decided to save more of their income, it…
Q: Price Level (average price) 1 5.8 Point a and point b. Point a and point d. Point b and point e.…
A: An economy's full employment level of output is defined as the production level that is achieved…
Q: Refer to Figure 9.1. When the price level rises and causes lower consumption expenditures, it is…
A: In an economy aggregate demand curve shows the total output demanded by the households and other…
Q: Given the Aggregate demand function of US AD= 5000 + 0.7Yd. Interpret this equation and…
A: Here, the aggregate demand function of United States is given as: AD= 5000 + 0.7Yd
Q: Select Correct and Explain why its correct: The multiplier model assumes that the: short-run…
A: According to Keynes, With the increase in investment there is multiple times increase in the income.…
Q: real GDP Q Figure C Figure D P level 60 P level 60 ASo LRAS LRAS 50 50 ASo 40 40 30 30 20 20 AD1 10…
A: In an economy, the concept of self-correction system of the market is given by the classical…
Q: Refer to Figure 13.10. Cost-push inflation occurs if the aggregate supply curve shifts from AS1…
A: Cost-push inflation occurs if a) the aggregate supply curve shifts from AS1 to AS2. b) the economy…
Q: Question 1 Increase aggregate supply - both SRAS and LRAS - occurs due to all of the following,…
A: Aggregate supply is the total supply of goods and services produced within an economy at a given…
Q: The level of economic activities will go into contraction (recession) in all of the following…
A: Contraction occurs when the economic activity in the economy falls. Economic activity refers to the…
Q: The size of the change in the quantity demanded of a good or service due to a change in its price is…
A: Hi Student, thanks for posting the question. As per the guideline we are providing answers for the…
Q: If a firm believes that their relative price has changed, then they will increase their output,…
A: The above given is a problem of Sticky price model which can be solved as follows:
Q: Refer to the information provided in Figi follow. P4 AS2 AS ASo Aggregate output Y Refer to Figure…
A: Aggregate supply refers to the overoll or total supply of goods and services produced within an…
Q: Sketch the aggregate demand curve for these two consumers. 10 8 B A 20 40 60 80 100 120 140 Qd 4- 2.
A: Aggregate demand means the total value of final goods and services that all sectors of economy all…
Q: Q25. Given demand and supply for the Cobweb model as follows, find the intertemporal equilibrium…
A: P = 3.14 with stable equilibrium P = 6.25 with unstable equilibrium
Q: Base on the aggregate demand-aggregate supply model, in the long-run, an increase in export sales…
A: Aggregate demand is composed of consumption spending, investment spending, government purchases and…
Q: Question 7 The model of aggregate demand and aggregate supply Answer is different from the model of…
A: Since you have asked multiple questions, we will solve the first question for you. If you want any…
Q: Consider the aggregate supply-aggregate demand (AD-AS) model that we saw in class. Assume that…
A: AD : Y = 1500 - 6P AS : Y = 900
Q: QUESTION 1 To determine the price level and aggregate output, the aggregate demand and aggregate…
A: "Aggregate demand is the demand of all finished goods and services produced in a year in the…
Q: how do i explain these answers
A: The monopoly is a market structure which is characterized by the presence of a single seller in the…
Q: Suppose that a hypothetical economy has the following relationship between its real output and the…
A: Since you have posted a question with multiple sub-parts, we will solve first three subparts for…
Q: uestion 27 The slope of a long-run aggregate supply curve is vertical, because full-employment…
A: “Since you have asked multiple question, we will solve the first question for you. If you want any…
Q: The Recovery: Utilizing the Aggregate Demand/Aggregate Supply framework describe what has happened…
A: Aggregate demand and supply are direct to the idea of demand and supply but are involved at a…
Q: (e) Given the following demand and supply functions for the cobweb model, find the intertemporal…
A: A> Qdt= 14-3Pt Qst= 14-3Pt Qdt=Qst hold where price does not change over time at equlibrium of…
Q: As per the additional (optional) article Cost of Supply Chain disruptions in 2020, all of the…
A: When economic agents take part in the production process, final goods and services are created for…
Q: Economics Question
A: A short-run market equilibrium is when Aae intersects with AS and that can be above, below, or equal…
Q: If aggregate demand is constant in an economy and aggregate supply decreases in the short run, which…
A: The aggregate demand and aggregate supply model is used to determine the equilibrium price level and…
Q: Suppose that the dynamic aggregate demand curve in Swaziland is determined by the equation M + U-6%.…
A: The quantity theory of money:The quantity theory of money equation can be written as follows:
Q: L Moving to another question will save this response. Question 10 Price Level P3 P2 P₁ Y₁ LRAS Y₂ an…
A: Leftward shift in SRAS shows decrease in short run aggregate supply.
Q: Given the Aggregate demand function of US AD= 5000 + 0.7Yd. Interpret this equation and…
A: Aggregate demand is the economic aspect to explain the total requirement for the domestic output by…
Q: Suppose that the aggregate demand and aggregate supply schedules for a hypothetical economy are as…
A:
Q: Question 6n Firms become more optimistic about the economy and decide to buy more capital goods.…
A: Answer - "Thank you for submitting the questions. But, we are authorized to solve one question at a…
Q: Question 4 Refer to the information provided in Figure 12.1 below to answer the questions that…
A: Question 4. Given The graph where the economy is at point A and the economy will move to point D.
Q: Question 44 A weakening in consumer confidence causes a O movement down along the aggregate demand…
A: Answer to the question is as follows:
Q: The figure below shows equilibrium in an aggregate demand-aggregate supply model. In this figure,…
A: Answer: d ( the actual price level is lower than expected) Explanation: If the actual price level is…
Q: Refer to the information provided in Figure 11.4 below to answer the questions that follow. AS2 ASo…
A: Aggregate supply(AS) or total output is the curve which shows us the total products and services…


Trending now
This is a popular solution!

Step by step
Solved in 3 steps with 2 images

- 18 - : If aggregate demand increases in an economy while aggregate demand is constant in the short run, which of the following statements is correct for the new equilibrium point?A) price decreases and national income increasesB) price rises national income risesC) price increases and national income does not changeD) price goes up and national income goes downE) price decreases and national income decreases.19 - : In which of the following expressions is the equation of change given correctly?A) MV=VK B) MT=PV C) MV=PT D) MP=VY E) MV=PComment, on the likely outcome with sufficient arguments? a) Impact on aggregate demand of the economy if imports are greater than exports.b) Impact on aggregate demand if the GDP of trading partner is increasing at a faster rate than that of India.c) Inflation rate in the country has reached 6.73%.Suppose firms become optimistic about futurebusiness conditions and invest heavily in new capitalequipment.a. Draw an aggregate-demand/aggregate-supplydiagram to show the short-run effect of thisoptimism on the economy. Label the new levels ofprices and real output. Explain in words why theaggregate quantity of output supplied changes.b. Now use the diagram from part (a) to show thenew long-run equilibrium of the economy. (Fornow, assume there is no change in the long-runaggregate-supply curve.) Explain in words whythe aggregate quantity of output demanded changesbetween the short run and the long run.c. How might the investment boom affect thelong-run aggregate-supply curve? Explain.
- Assume an economy operates in the intermediaterange of its aggregate supply curve. State thedirection of shift for the aggregate demandor aggregate supply curve for each of thefollowing changes in conditions. What is theeffect on the price level? On real GDP? Onemployment?a. The price of crude oil rises significantly.b. Spending on national defense doubles.c. The costs of imported goods increase.d. An improvement in technology raises laborproductivity.Based on the below information, help Renwick economy find the equilibrium level of output. Aggregate Demand Aggregate Supply Equilibrium YAD = C + I + G YAS = A Kα L1-α YR =0.5YAD+ 0.5YAS C = 600 + βYD A = (1 + g) Ao YD = YR + TR - tYR K = 35 TR = 55 L = 80 G = 120 g = 6% I = 50 Ao = 150 t = 0.15 α = 0.65 Where C is private consumption, YD is disposable income; TR, G and I are transfer payments, government spending and total investment, respectively. A in the index of technology and K and L are capital and labour inputs. A0 is the initial levels of A and L, both assumed to be 150, while g is the growth rates. The MPC is 0.60. a.) Find aggregate demand…Suppose that the economy's long-run output level is produces accourding to the following production funciton: Y= AK^1/2L^1/2 (will attach picture of the function) and that A = 5, K = 400 and L = 100 A. What is the economic meaning of the powers of K and L? B. What is the level of output ? produced when the economy in long-run equilibrium. C. Suppose that aggregate demand in the economy is described by the following equation:Y^d = m/kP Where M is the money supply, P is the price level and k = 1/V (velocity of money). Explain carefully where this equation is derived from and its interpretation D. Suppose that M = 2000 and that k = 2. What is the price level P at which the economy is in long-run- equilibrium? Plot such an equilibrium on a diagram with P on the vertical axis and Y on the horizontal axis, by distinguishing between the short-run and the long-run equilibrium. E. Now suppose that starting from the equilibrium of (b) and (c), the Central Bank increases M to 3000. Calculate…
- Consider the following actual and forecast demandlevels for Big Mac hamburgers at a local McDonald’s restaurant:DAY ACTUAL DEMAND FORECAST DEMANDMonday 88 88Tuesday 72 88Wednesday 68 84Thursday 48 80FridayThe forecast for Monday was derived by observing Monday’sdemand level and setting Monday’s forecast level equal to this demand level. Subsequent forecasts were derived by using expo-nential smoothing with a smoothing constant of 0.25. Using this exponential smoothing method, what is the forecast for Big Macdemand for Friday?Question 01 Due to COVID-19 situations the oil prices fall in international market. Let’s assume that output starts at its natural level. What happens to the country A's economy (output and price) in the short run? Explain your answer using AS-AD graphs.1-What is the general relationship between a country's price level and the quantitiy of it's domestic output (Real GDP) demanded? Who are the buyers of real US GDP? 2- what assumptions cause the immediate -short-run aggregate supply curve to be horizontal? why is the long-run aggregate supply curve vertical? Explain the shape of the short-run aggregate supply curve . Why is the short-run curve relatively flat to the left of the full employment output and relatively steep to the right ? 3- why does a reduction in aggregate demand tend to reduce real output, rather than the price level? 4- Explain" unemployment can be caused by a decrease of aggregate demand or a decrease of aggregate supply ."In each case , specify the price level outcomes . 5- In early 2001 investment spending declined in the USA. In the 2 months follwing september , 11 2001 attacks on the US, consumption also declined . Use Ad-AS analysis to show the two impacts on Real GDP. 6- Using the concept of the multiplier ,…
- 3. Did the Covid-19 recession shift the aggregate supply (AS) curve? If so, how?Please no written by hand solution Consider the following economic situations:C = $4.0 trillionI = $1.5 trillionG = $3.0 trillionT = $3.0 trillionNX = $1.0 trillionF = 0mpc = 0.8d = 0.35x = 0.15r = 1% λ = 0.5A. Calculate an expression for the IS, MP and AD curves ( r= ?, IS Y= ?, AD Y=?)B. Let AS curve be given by the relation: π = 6 + 1.5 (Y - 25.5) (i.e. the price shock is zero). What are the equilibrium values of inflation, output and the real interest rate(π, Y, r)?C. Suppose government purchases are raised from $3.0 trillion to $3.5 trillion. What are new short-run equilibrium inflation values, output and the real interest rate (π, Y, r}?D. Suppose a financial crisis begins, and ƒ increases ƒ = 3. (Assume government purchases are again as in part (a). What are the new short-run equilibrium values of inflation, output, and the interest rate (π, Y, r}?(Please solve all the parts with numerical steps so it could be practiced easily)Real GDP Real GDPDemanded, Price Level Supplied,Billions (Price Index) Billions$100 300 $450200 250 400300 200 300400 150 200500 100 100 Use these sets of data to graph the aggregate demandand aggregate supply curves. What is the equilibriumprice level and the equilibrium level of real output inthis hypothetical economy? Is the equilibrium real output also necessarily the full-employment real output?Explain.b. Why will a price level of 150 not be an equilibriumprice level in this economy? Why not 250?c. Suppose that buyers desire to purchase $200 billion ofextra real output at each price level. Sketch in the newaggregate demand curve as AD1. What factors mightcause this change in aggregate demand? What is thenew equilibrium price level and level of real output?
