real GDP Q Figure C Figure D P level 60 P level 60 ASo LRAS LRAS 50 50 ASo 40 40 30 30 20 20 AD1 10 10 ADo -AD1H CADO- 0. 10 20 30 40 50 10 20 30 40 50 real GDP = Q real GDP = Q 31. Assuming Aggregate Demand and Aggregate Supply are initially at ADo and ASo respectively, and AD1 and AS1 represent changes, which of the above graphs depict the economy's self-correcting mechanism at work? O Figures A & B Figures A & C Figures C & D Figures B & D
real GDP Q Figure C Figure D P level 60 P level 60 ASo LRAS LRAS 50 50 ASo 40 40 30 30 20 20 AD1 10 10 ADo -AD1H CADO- 0. 10 20 30 40 50 10 20 30 40 50 real GDP = Q real GDP = Q 31. Assuming Aggregate Demand and Aggregate Supply are initially at ADo and ASo respectively, and AD1 and AS1 represent changes, which of the above graphs depict the economy's self-correcting mechanism at work? O Figures A & B Figures A & C Figures C & D Figures B & D

Chapter19: Measuring Economic Performance
Section: Chapter Questions
Problem 1P

Related questions
Question
Transcribed Image Text:real GDP = Q
real GDP = Q
Figure C
Figure D
P level
60
P level
60
ASo
LRAS
LRAS
50
50
ASo
40
40
30
30
20
20
AD1
10
10
ADo
ADo
-AD1H
ㅇ
10 20
30
40
10
30
40 50
real GDP = Q
%3D
real GDP = Q
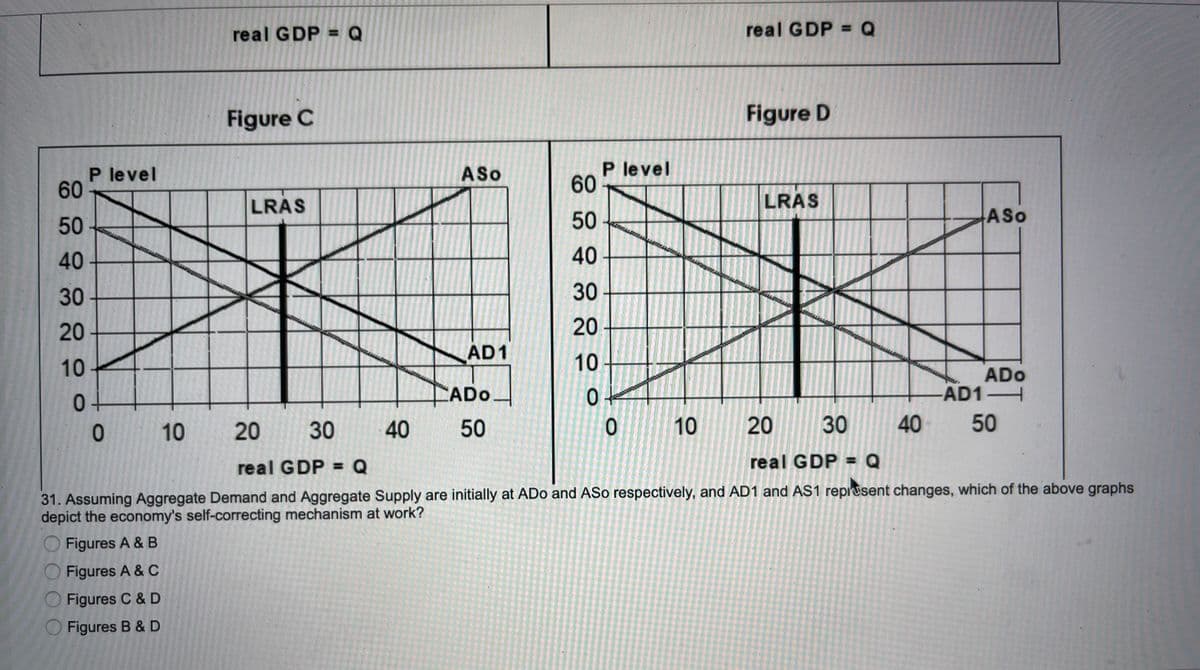
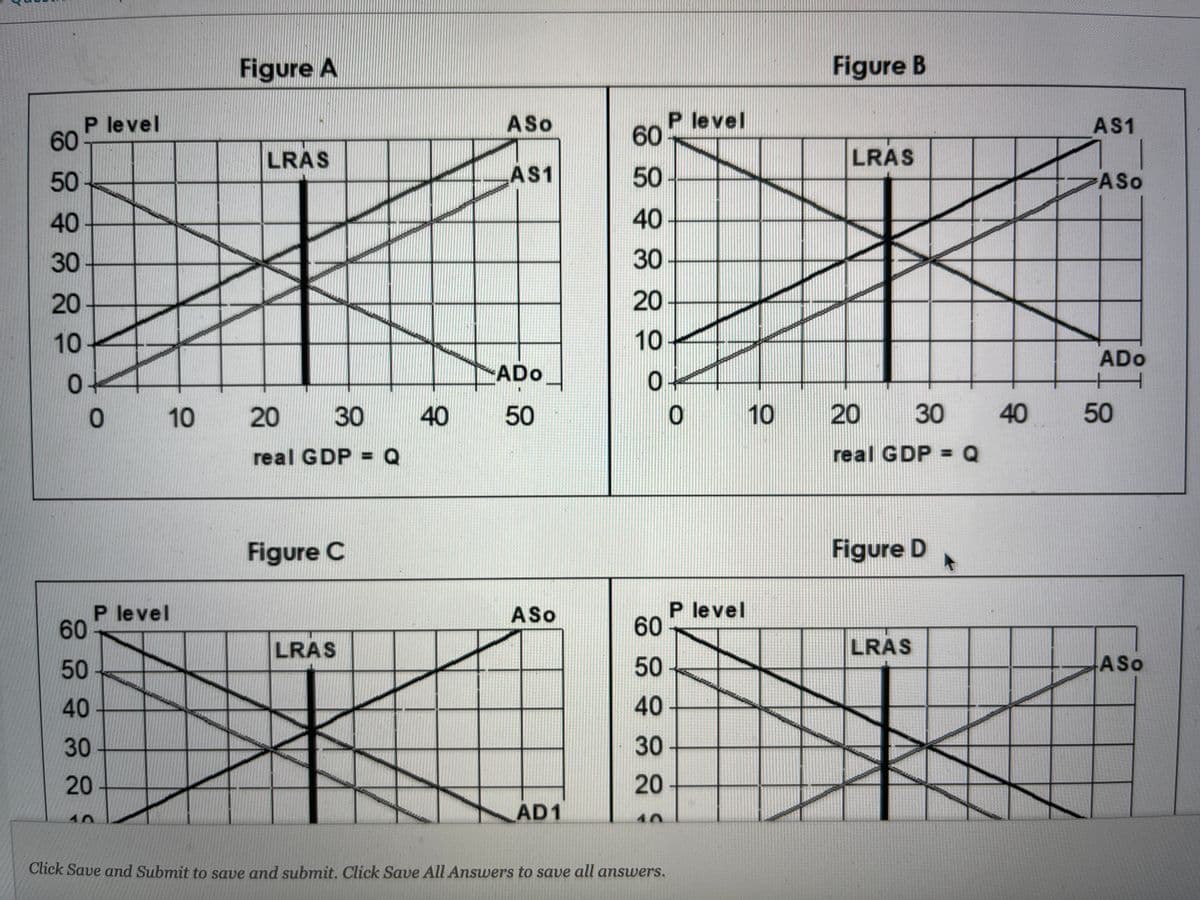
31. Assuming Aggregate Demand and Aggregate Supply are initially at ADo and ASo respectively, and AD1 and AS1 repiusent changes, which of the above graphs
depict the economy's self-correcting mechanism at work?
Figures A & B
Figures A & C
Figures C & D
Figures B & D
20
50
Transcribed Image Text:Figure A
Figure B
P level
60
P level
60
ASo
AS1
LRAS
LRAS
50
AS1
50
ASo
40
40
30
30
20
20
10
10
ADo
01
ADo
10
20
30
40
50
10
20
30
40
50
real GDP = Q
real GDP = Q
Figure C
Figure D
P level
60
P level
60
ASo
LRAS
LRAS
50
50
ASo
40
40
30
30
20
20
AD1
10
Click Save and Submit to save and submit. Click Save All Answers to save all answers.
은
Expert Solution
This question has been solved!
Explore an expertly crafted, step-by-step solution for a thorough understanding of key concepts.

This is a popular solution!

Trending now
This is a popular solution!

Step by step
Solved in 2 steps

Knowledge Booster


Learn more about
Need a deep-dive on the concept behind this application? Look no further. Learn more about this topic, economics and related others by exploring similar questions and additional content below.Recommended textbooks for you
Exploring Economics
Economics
ISBN:
9781544336329
Author:
Robert L. Sexton
Publisher:
SAGE Publications, Inc


Principles of Economics 2e
Economics
ISBN:
9781947172364
Author:
Steven A. Greenlaw; David Shapiro
Publisher:
OpenStax
Exploring Economics
Economics
ISBN:
9781544336329
Author:
Robert L. Sexton
Publisher:
SAGE Publications, Inc
Principles of Economics 2e
Economics
ISBN:
9781947172364
Author:
Steven A. Greenlaw; David Shapiro
Publisher:
OpenStax