Ammonia vapor is compressed to 60 bar and 105°C. Use the SRK equation of state to determine the vapor mass density (g/L). For ammonia, T. = 405.5 K, P. = 111.3 atm, and <= 0.257. a. Determine Tr, a, b, m, and a. b. Plot the pressure as a function of specific volume over a range of 0.05-5 L/mol. Make sure to properly label the axes. Plot a sufficient number of points to get a smooth curve and use a logarithmic scale for the x-axis. You must use Excel to prepare your plot. Axes should be properly labelled, and the plot must have a title. c. Determine the specific volume of ammonia vapor at 60 bar and 105°C (L/mol).
Ammonia vapor is compressed to 60 bar and 105°C. Use the SRK equation of state to determine the vapor mass density (g/L). For ammonia, T. = 405.5 K, P. = 111.3 atm, and <= 0.257. a. Determine Tr, a, b, m, and a. b. Plot the pressure as a function of specific volume over a range of 0.05-5 L/mol. Make sure to properly label the axes. Plot a sufficient number of points to get a smooth curve and use a logarithmic scale for the x-axis. You must use Excel to prepare your plot. Axes should be properly labelled, and the plot must have a title. c. Determine the specific volume of ammonia vapor at 60 bar and 105°C (L/mol).

Introduction to Chemical Engineering Thermodynamics
8th Edition
ISBN:9781259696527
Author:J.M. Smith Termodinamica en ingenieria quimica, Hendrick C Van Ness, Michael Abbott, Mark Swihart
Publisher:J.M. Smith Termodinamica en ingenieria quimica, Hendrick C Van Ness, Michael Abbott, Mark Swihart
Chapter1: Introduction
Section: Chapter Questions
Problem 1.1P

Related questions
Question
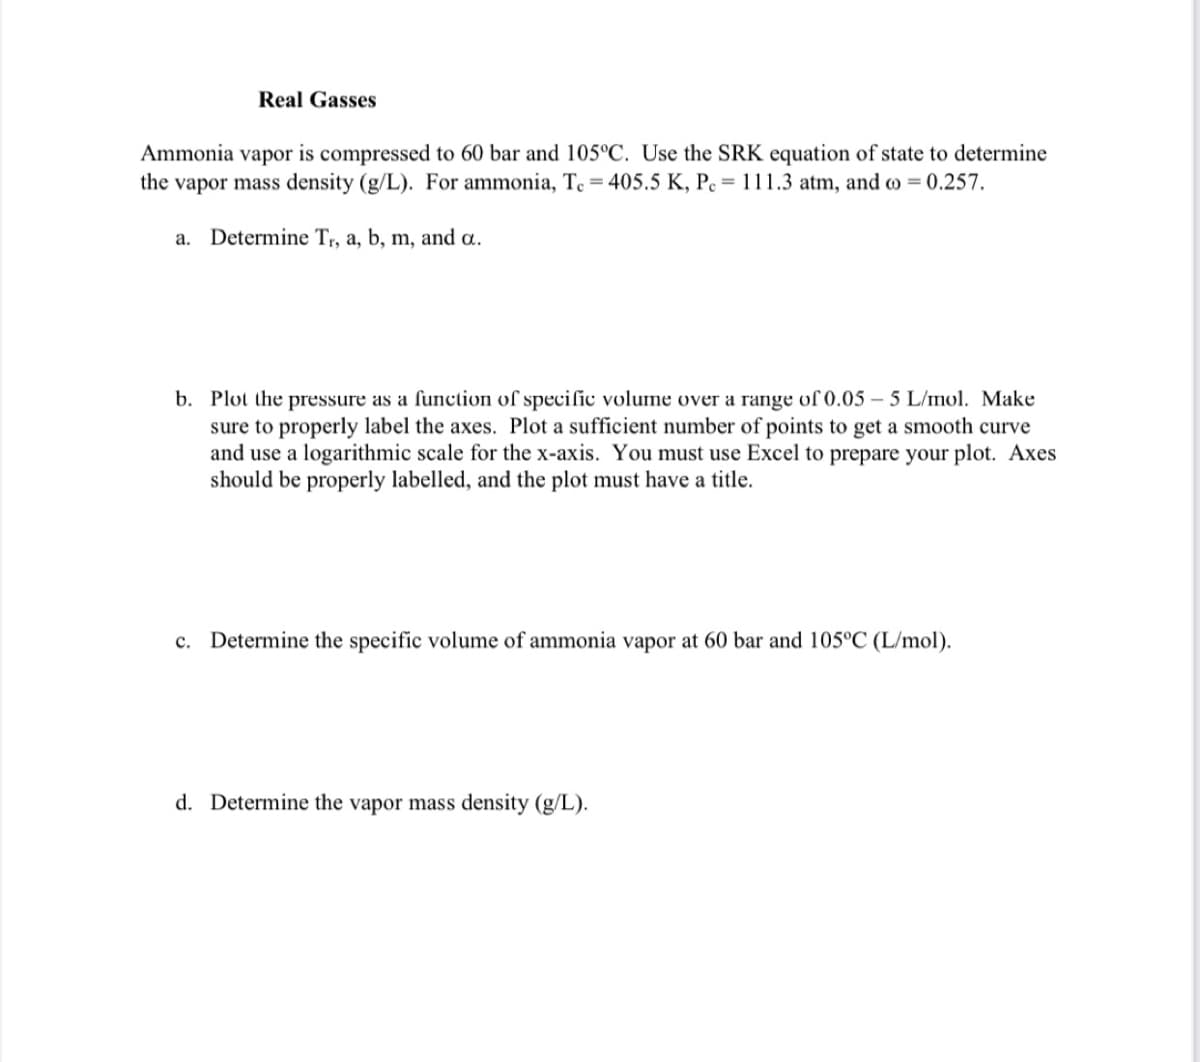
Transcribed Image Text:Real Gasses
Ammonia vapor is compressed to 60 bar and 105°C. Use the SRK equation of state to determine
the vapor mass density (g/L). For ammonia, T. = 405.5 K, Pc = 111.3 atm, and to = 0.257.
a. Determine Tr, a, b, m, and a.
b. Plot the pressure as a function of specific volume over a range of 0.05-5 L/mol. Make
sure to properly label the axes. Plot a sufficient number of points to get a smooth curve
and use a logarithmic scale for the x-axis. You must use Excel to prepare your plot. Axes
should be properly labelled, and the plot must have a title.
c. Determine the specific volume of ammonia vapor at 60 bar and 105°C (L/mol).
d. Determine the vapor mass density (g/L).
Expert Solution
This question has been solved!
Explore an expertly crafted, step-by-step solution for a thorough understanding of key concepts.

This is a popular solution!

Trending now
This is a popular solution!

Step by step
Solved in 5 steps with 5 images

Recommended textbooks for you
Introduction to Chemical Engineering Thermodynami…
Chemical Engineering
ISBN:
9781259696527
Author:
J.M. Smith Termodinamica en ingenieria quimica, Hendrick C Van Ness, Michael Abbott, Mark Swihart
Publisher:
McGraw-Hill Education

Elementary Principles of Chemical Processes, Bind…
Chemical Engineering
ISBN:
9781118431221
Author:
Richard M. Felder, Ronald W. Rousseau, Lisa G. Bullard
Publisher:
WILEY

Elements of Chemical Reaction Engineering (5th Ed…
Chemical Engineering
ISBN:
9780133887518
Author:
H. Scott Fogler
Publisher:
Prentice Hall
Introduction to Chemical Engineering Thermodynami…
Chemical Engineering
ISBN:
9781259696527
Author:
J.M. Smith Termodinamica en ingenieria quimica, Hendrick C Van Ness, Michael Abbott, Mark Swihart
Publisher:
McGraw-Hill Education
Elementary Principles of Chemical Processes, Bind…
Chemical Engineering
ISBN:
9781118431221
Author:
Richard M. Felder, Ronald W. Rousseau, Lisa G. Bullard
Publisher:
WILEY
Elements of Chemical Reaction Engineering (5th Ed…
Chemical Engineering
ISBN:
9780133887518
Author:
H. Scott Fogler
Publisher:
Prentice Hall


Industrial Plastics: Theory and Applications
Chemical Engineering
ISBN:
9781285061238
Author:
Lokensgard, Erik
Publisher:
Delmar Cengage Learning

Unit Operations of Chemical Engineering
Chemical Engineering
ISBN:
9780072848236
Author:
Warren McCabe, Julian C. Smith, Peter Harriott
Publisher:
McGraw-Hill Companies, The