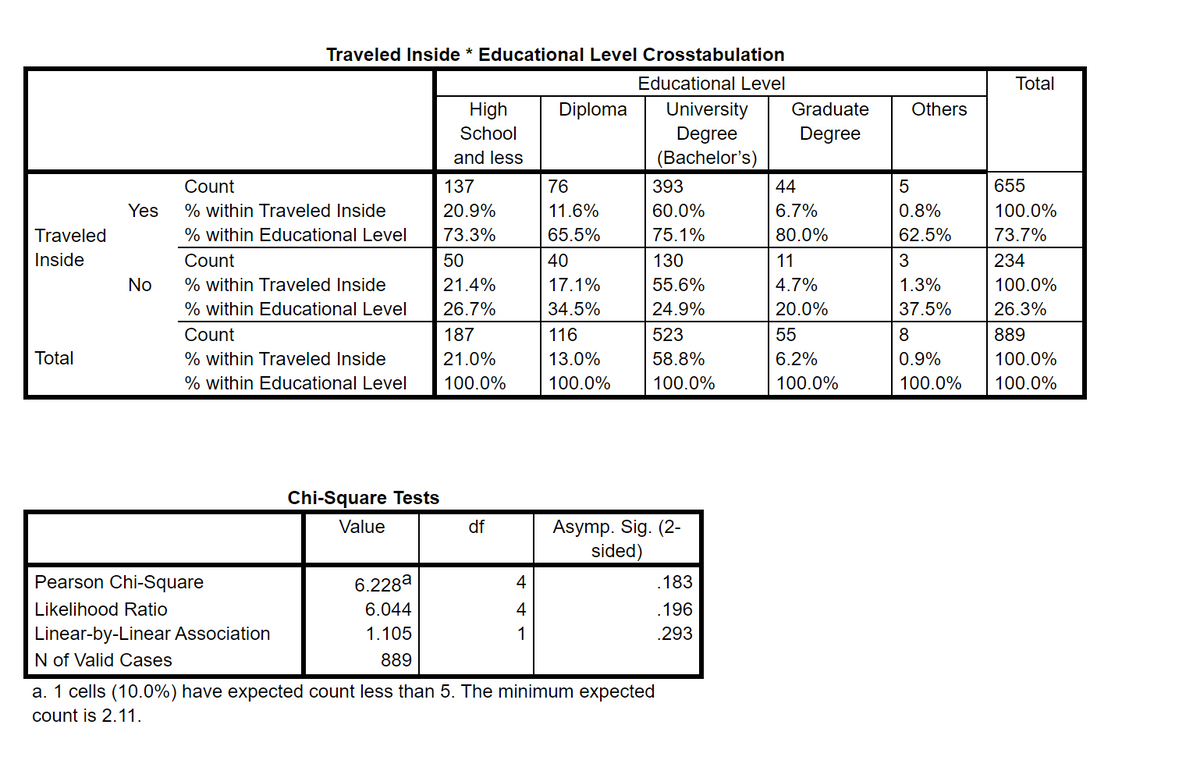
Among those respondents who did not travel inside, what proportion is holding graduate degree. a) 4.7% b) 6.2% c) 6.7% d) 20.0% 2- Which of the following research question(s) can the tables be used to answer? a) Is there a relationship between “travel inside” and the educational level variables? b) Does the educational level affect traveling inside decision? c) Both A and B d) The tables can NOT be used to answer any research question; they only provide descriptive analysis. 3-- Among those who hold a “Diploma”, what is the proportion of those who traveled inside?
Among those respondents who did not travel inside, what proportion is holding graduate degree. a) 4.7% b) 6.2% c) 6.7% d) 20.0% 2- Which of the following research question(s) can the tables be used to answer? a) Is there a relationship between “travel inside” and the educational level variables? b) Does the educational level affect traveling inside decision? c) Both A and B d) The tables can NOT be used to answer any research question; they only provide descriptive analysis. 3-- Among those who hold a “Diploma”, what is the proportion of those who traveled inside?
Chapter9: Sequences, Probability And Counting Theory
Section9.7: Probability
Problem 2SE: What is a sample space?
Related questions
Topic Video
Question
1- Among those respondents who did not travel inside, what proportion is holding graduate degree.
a) 4.7%
b) 6.2%
c) 6.7%
d) 20.0%
2- Which of the following research question(s) can the tables be used to answer?
a) Is there a relationship between “travel inside” and the educational level variables?
b) Does the educational level affect traveling inside decision?
c) Both A and B
d) The tables can NOT be used to answer any research question; they only provide descriptive analysis.
3-- Among those who hold a “Diploma”, what is the proportion of those who traveled inside?
4-- What does the Pearson Chi-Square’s significance test indicate? Explain the results.

Transcribed Image Text:Traveled Inside * Educational Level Crosstabulation
Educational Level
Total
High
University
Degree
(Bachelor's)
Diploma
Graduate
Others
School
Degree
and less
Count
137
76
393
44
655
Yes
% within Traveled Inside
20.9%
11.6%
60.0%
6.7%
0.8%
100.0%
Traveled
% within Educational Level
73.3%
65.5%
75.1%
80.0%
62.5%
73.7%
Inside
Count
50
40
130
11
234
No
% within Traveled Inside
21.4%
17.1%
55.6%
4.7%
1.3%
100.0%
% within Educational Level
26.7%
34.5%
24.9%
20.0%
37.5%
26.3%
Count
187
116
523
55
8
889
Total
% within Traveled Inside
21.0%
13.0%
58.8%
6.2%
0.9%
100.0%
% within Educational Level
100.0%
100.0%
100.0%
100.0%
100.0%
100.0%
Chi-Square Tests
Value
Asymp. Sig. (2-
sided)
df
Pearson Chi-Square
6.228a
4
.183
Likelihood Ratio
6.044
4
.196
Linear-by-Linear Association
N of Valid Cases
1.105
.293
889
a. 1 cells (10.0%) have expected count less than 5. The minimum expected
count is 2.11.
Expert Solution
This question has been solved!
Explore an expertly crafted, step-by-step solution for a thorough understanding of key concepts.
Step by step
Solved in 2 steps

Knowledge Booster
Learn more about
Need a deep-dive on the concept behind this application? Look no further. Learn more about this topic, statistics and related others by exploring similar questions and additional content below.Recommended textbooks for you

