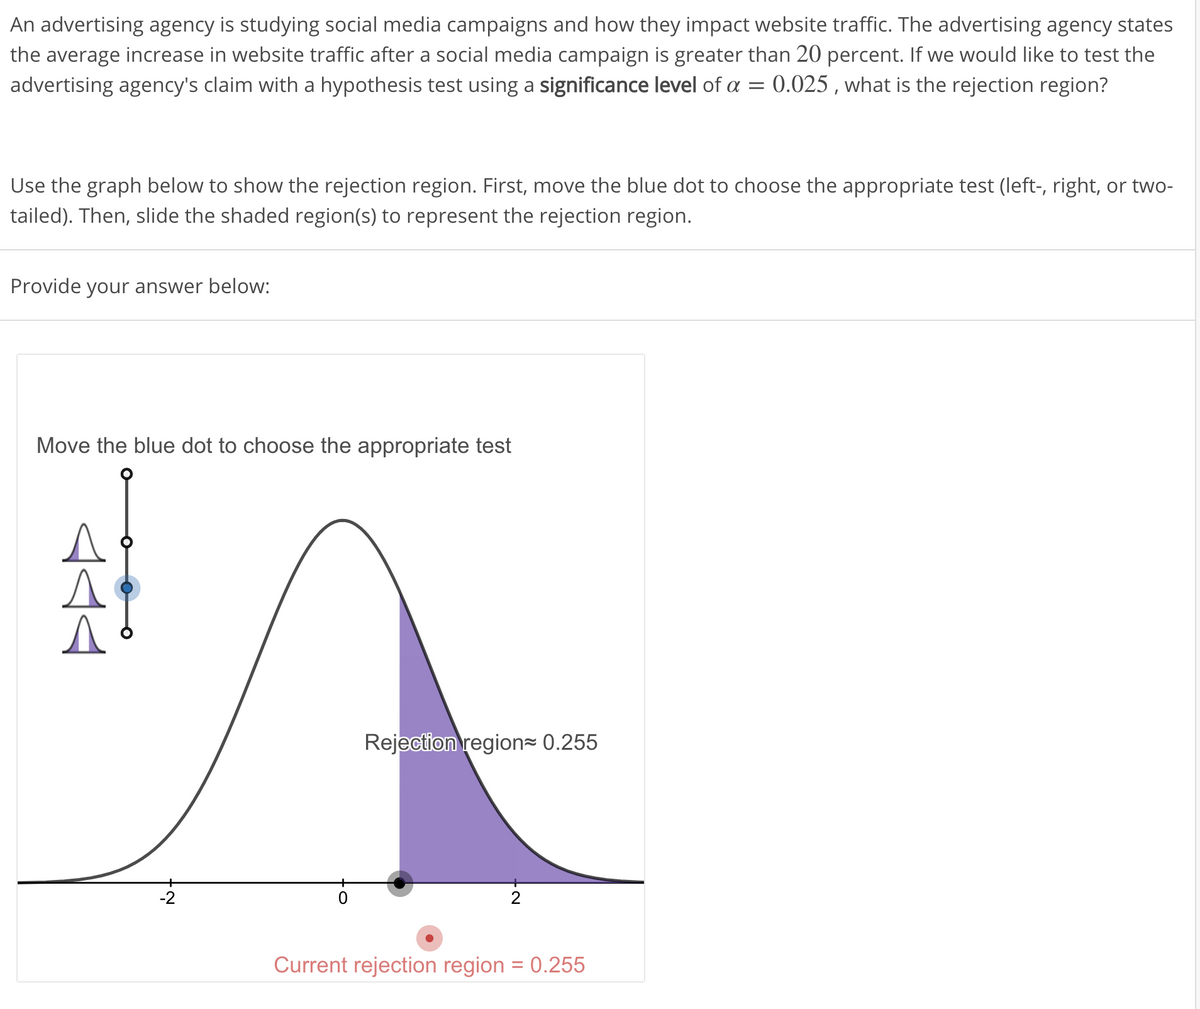
An advertising agency is studying social media campaigns and how they impact website traffic. The advertising agency states the average increase in website traffic after a social media campaign is greater than 20 percent. If we would like to test the advertising agency's claim with a hypothesis test using a significance level of a = 0.025 , what is the rejection region? Use the graph below to show the rejection region. First, move the blue dot to choose the appropriate test (left-, right, or two- tailed). Then, slide the shaded region(s) to represent the rejection region. Provide your answer below: Move the blue dot to choose the appropriate test Rejection region= 0.255 -2 Current rejection region = 0.255 AAP
An advertising agency is studying social media campaigns and how they impact website traffic. The advertising agency states the average increase in website traffic after a social media campaign is greater than 20 percent. If we would like to test the advertising agency's claim with a hypothesis test using a significance level of a = 0.025 , what is the rejection region? Use the graph below to show the rejection region. First, move the blue dot to choose the appropriate test (left-, right, or two- tailed). Then, slide the shaded region(s) to represent the rejection region. Provide your answer below: Move the blue dot to choose the appropriate test Rejection region= 0.255 -2 Current rejection region = 0.255 AAP

Glencoe Algebra 1, Student Edition, 9780079039897, 0079039898, 2018
18th Edition
ISBN:9780079039897
Author:Carter
Publisher:Carter
Chapter10: Statistics
Section10.3: Measures Of Spread
Problem 1GP

Related questions
Topic Video
Question
Transcribed Image Text:An advertising agency is studying social media campaigns and how they impact website traffic. The advertising agency states
the average increase in website traffic after a social media campaign is greater than 20 percent. If we would like to test the
advertising agency's claim with a hypothesis test using a significance level of a = 0.025 , what is the rejection region?
Use the graph below to show the rejection region. First, move the blue dot to choose the appropriate test (left-, right, or two-
tailed). Then, slide the shaded region(s) to represent the rejection region.
Provide your answer below:
Move the blue dot to choose the appropriate test
Rejection region= 0.255
-2
Current rejection region = 0.255
Expert Solution
This question has been solved!
Explore an expertly crafted, step-by-step solution for a thorough understanding of key concepts.

This is a popular solution!

Trending now
This is a popular solution!

Step by step
Solved in 2 steps with 1 images

Knowledge Booster


Learn more about
Need a deep-dive on the concept behind this application? Look no further. Learn more about this topic, statistics and related others by exploring similar questions and additional content below.Recommended textbooks for you
Glencoe Algebra 1, Student Edition, 9780079039897…
Algebra
ISBN:
9780079039897
Author:
Carter
Publisher:
McGraw Hill

College Algebra (MindTap Course List)
Algebra
ISBN:
9781305652231
Author:
R. David Gustafson, Jeff Hughes
Publisher:
Cengage Learning
Glencoe Algebra 1, Student Edition, 9780079039897…
Algebra
ISBN:
9780079039897
Author:
Carter
Publisher:
McGraw Hill
College Algebra (MindTap Course List)
Algebra
ISBN:
9781305652231
Author:
R. David Gustafson, Jeff Hughes
Publisher:
Cengage Learning