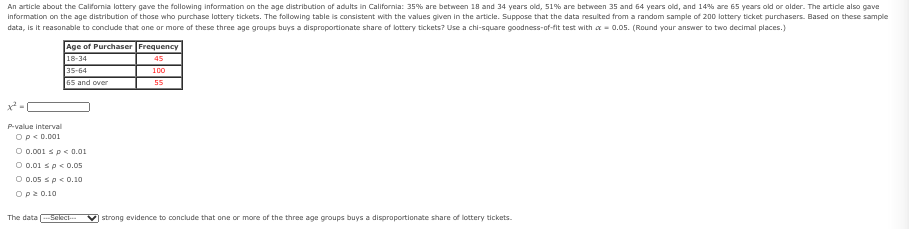
An article about the Califormia lattery gave the following information on the age distribution of adults in California: 35% are between 18 and 34 years old, 51% are between 35 and 64 years old, and 14% are 65 years old or alder. The artide also gave Information on the age distribution of those who purchase lattery tickets. The following table is consistent with the values given in the article. Suppose that the data resulted from a random sample of 200 lattery ticket purchasers. Based on these sample data, is it reasonable to condude that ane ar more af these three age groups buys a disproportionate share af lottery tickets? Use a chi-square goodness-of-fit test with a- 0.05. (Round your answer to two decimal places.) Age of Purchaser Frequency 18-34 35-64 65 and over 45 100 55 P-value interval Op< 0.001 O 0.001 sp 0.01 O 0.01 sp< 0.05 O 0.05 sp< 0.10 Op20.10 The data Sekci strong evidence to conclude that one or more of the three age groups buys a disproportionate share of lottery tickets.

Glencoe Algebra 1, Student Edition, 9780079039897, 0079039898, 2018
18th Edition
ISBN:9780079039897
Author:Carter
Publisher:Carter
Chapter10: Statistics
Section10.4: Distributions Of Data
Problem 19PFA
icon
Related questions
icon
Concept explainers
Question
An article about the California lattery gave the following information on the age distribution of adults in California: 35% are between 18 and 34 years old, 51% are between 35 and 64 years old, and 14% are 65 years old or older. The artide also gave
Information on the age distribution of those who purchase lottery tickets. The following table is consistent with the values given in the article. Suppose that the data resulted from a random sample of 200 lattery ticket purchasers. Based on these sample
data, is it reasonable to condude that ane or more af these three age groups buys a disproportionate share of lottery tickets? Use a chi-square goodness-of-fit test with a- 0.05. (Round your answer to two decimal places.)
Age of Purchaser Frequency
18-34
45
35-64
100
65 and over
55
P-value interval
Op<D.001
O 0.001 sp < 0.01
O 0.01 sp< 0.05
O 0.05 sp< 0.10
Op2 0.10
The data eleci--
strong evidence to conclude that one or more of the three age groups buys a disproportionate share of lottery tickets.
Transcribed Image Text:An article about the California lattery gave the following information on the age distribution of adults in California: 35% are between 18 and 34 years old, 51% are between 35 and 64 years old, and 14% are 65 years old or older. The artide also gave Information on the age distribution of those who purchase lottery tickets. The following table is consistent with the values given in the article. Suppose that the data resulted from a random sample of 200 lattery ticket purchasers. Based on these sample data, is it reasonable to condude that ane or more af these three age groups buys a disproportionate share of lottery tickets? Use a chi-square goodness-of-fit test with a- 0.05. (Round your answer to two decimal places.) Age of Purchaser Frequency 18-34 45 35-64 100 65 and over 55 P-value interval Op<D.001 O 0.001 sp < 0.01 O 0.01 sp< 0.05 O 0.05 sp< 0.10 Op2 0.10 The data eleci-- strong evidence to conclude that one or more of the three age groups buys a disproportionate share of lottery tickets.
Expert Solution
trending now

Trending now

This is a popular solution!

steps

Step by step

Solved in 2 steps with 2 images

Blurred answer
Knowledge Booster
Continuous Probability Distribution
Learn more about
Need a deep-dive on the concept behind this application? Look no further. Learn more about this topic, statistics and related others by exploring similar questions and additional content below.
Recommended textbooks for you
Glencoe Algebra 1, Student Edition, 9780079039897…
Algebra
ISBN:
9780079039897
Author:
Carter
Publisher:
McGraw Hill
Holt Mcdougal Larson Pre-algebra: Student Edition…
Algebra
ISBN:
9780547587776
Author:
HOLT MCDOUGAL
Publisher:
HOLT MCDOUGAL