The table below summarizes data from a survey of a sample of women. Using a 0.01 significance level, and assuming that the sample sizes of 800 men and 400 women are predetermined, test the claim that the proportions of agree/disagree responses are the same for subjects interviewed by men and the subjects interviewed by women. Does it appear that the gender of the interviewer affected the responses of women? Gender of Interviewer Man Woman Women who agree Women who disagree 554 327 246 73 Click here to view the chi-square distribution table. Identify the null and alternative hypotheses. Choose the correct answer below. O A. Ho: The proportions of agree/disagree responses are different for the subjects interviewed by men and the subjects interviewed by women. H4: The proportions are the same. O B. Ho: The proportions of agree/disagree responses are the same for the subjects interviewed by men and the subjects interviewed women. H: The proportions are different. OC. Ho: The response of the subject and the gender of the subject are independent. H,: The response of the subject and the gender of the subject are dependent. Compute the test statistic. (Round to three decimal places as needed.) Find the critical value(s). (Round to three decimal places as needed. Use a comma to separate answers as needed.) What is the conclusion based on the hypothesis test? V Ho. There v sufficient evidence to warrant rejection of the claim that the proportions of agree/disagree responses are the same for subjects interviewed by men and the subjects interviewed by women. It v that the gender of the interviewer affected the responses of women.
The table below summarizes data from a survey of a sample of women. Using a 0.01 significance level, and assuming that the sample sizes of 800 men and 400 women are predetermined, test the claim that the proportions of agree/disagree responses are the same for subjects interviewed by men and the subjects interviewed by women. Does it appear that the gender of the interviewer affected the responses of women? Gender of Interviewer Man Woman Women who agree Women who disagree 554 327 246 73 Click here to view the chi-square distribution table. Identify the null and alternative hypotheses. Choose the correct answer below. O A. Ho: The proportions of agree/disagree responses are different for the subjects interviewed by men and the subjects interviewed by women. H4: The proportions are the same. O B. Ho: The proportions of agree/disagree responses are the same for the subjects interviewed by men and the subjects interviewed women. H: The proportions are different. OC. Ho: The response of the subject and the gender of the subject are independent. H,: The response of the subject and the gender of the subject are dependent. Compute the test statistic. (Round to three decimal places as needed.) Find the critical value(s). (Round to three decimal places as needed. Use a comma to separate answers as needed.) What is the conclusion based on the hypothesis test? V Ho. There v sufficient evidence to warrant rejection of the claim that the proportions of agree/disagree responses are the same for subjects interviewed by men and the subjects interviewed by women. It v that the gender of the interviewer affected the responses of women.

Glencoe Algebra 1, Student Edition, 9780079039897, 0079039898, 2018
18th Edition
ISBN:9780079039897
Author:Carter
Publisher:Carter
Chapter4: Equations Of Linear Functions
Section: Chapter Questions
Problem 8SGR

Related questions
Question
q11
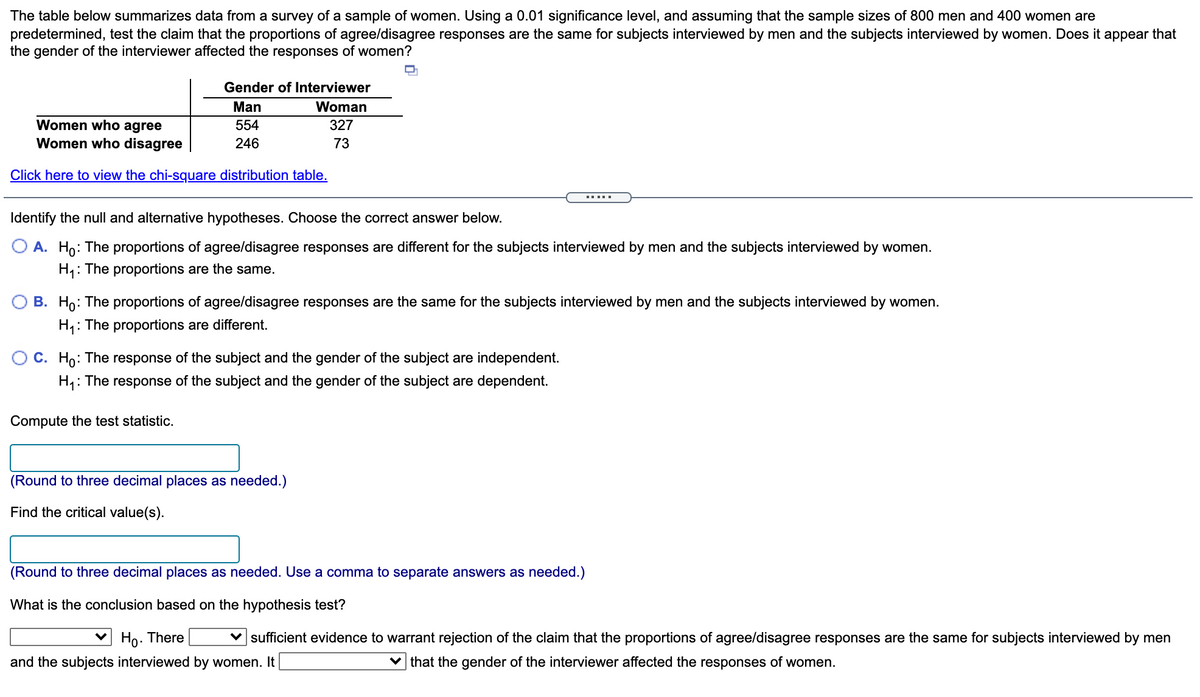
Transcribed Image Text:The table below summarizes data from a survey of a sample of women. Using a 0.01 significance level, and assuming that the sample sizes of 800 men and 400 women are
predetermined, test the claim that the proportions of agree/disagree responses are the same for subjects interviewed by men and the subjects interviewed by women. Does it appear that
the gender of the interviewer affected the responses of women?
Gender of Interviewer
Man
Woman
Women who agree
554
327
Women who disagree
246
73
Click here to view the chi-square distribution table.
Identify the null and alternative hypotheses. Choose the correct answer below.
O A. Ho: The proportions of agree/disagree responses are different for the subjects interviewed by men and the subjects interviewed by women.
H: The proportions are the same.
B. Ho: The proportions of agree/disagree responses are the same for the subjects interviewed by men and the subjects interviewed by women.
H4: The proportions are different.
C. Ho: The response of the subject and the gender of the subject are independent.
H,: The response of the subject and the gender of the subject are dependent.
Compute the test statistic.
(Round to three decimal places as needed.)
Find the critical value(s).
(Round to three decimal places as needed. Use a comma to separate answers as needed.)
What is the conclusion based on the hypothesis test?
V Ho. There
v sufficient evidence to warrant rejection of the claim that the proportions of agree/disagree responses are the same for subjects interviewed by men
and the subjects interviewed by women. It
v that the gender of the interviewer affected the responses of women.
Expert Solution
This question has been solved!
Explore an expertly crafted, step-by-step solution for a thorough understanding of key concepts.

This is a popular solution!

Trending now
This is a popular solution!

Step by step
Solved in 2 steps with 2 images

Recommended textbooks for you
Glencoe Algebra 1, Student Edition, 9780079039897…
Algebra
ISBN:
9780079039897
Author:
Carter
Publisher:
McGraw Hill

College Algebra (MindTap Course List)
Algebra
ISBN:
9781305652231
Author:
R. David Gustafson, Jeff Hughes
Publisher:
Cengage Learning
Glencoe Algebra 1, Student Edition, 9780079039897…
Algebra
ISBN:
9780079039897
Author:
Carter
Publisher:
McGraw Hill
College Algebra (MindTap Course List)
Algebra
ISBN:
9781305652231
Author:
R. David Gustafson, Jeff Hughes
Publisher:
Cengage Learning