The following table shows age distribution and location of a random sample of 166 buffalo in a national park. Firehole District 17 16 26 59 Lamar District Nez Perce District 13 8 30 51 Row Total Age Calf 41 33 92 166 Use a chi-square test to determine if age distribution and location are independent at the 0.05 level of significance. 11 Yearling Adult 36 56 Column Total (a) What is the level of significance? State the null and alternate hypotheses. O H: Age distribution and location are not independent. H,: Age distribution and location are not independent. Ho: Age distribution and location are independent. H,: Age distribution and location are independent. O Ho: Age distribution and location are not independent. H: Age distribution and location are independent. O Ho: Age distribution and location are independent. H: Age distribution and location are not independent. (b) Find the value of the chi-square statistic for the sample. (Round the expected frequencies to at least three decimal places. Round the test statistic to three decimal places.) Are all the expected frequencies greater than 5? O Yes O No What sampling distribution will you use? O binomial O uniform normal O chi-square O Student's t What are the degrees of freedom? (c) Find or estimate the P-value of the sample test statistic. (Round your answer to three decimal places.) (d) Based on your answers in parts (a) to (c), will you reject or fail to reject the null hypothesis of independence? O Since the P-value > «, we fail to reject the null hypothesis. s. O Since the P-value > x, we reject the null hypothesis. Since the P-value s x, we reject the null hypothesis. Since the P-value s x, we fail to reject the null hypothesis. (e) Interpret your conclusion in the context of the application. O At the 5% level of significance, there is sufficient evidence to conclude that age distribution and location are not independent. O At the 5% level of significance, there is insufficient evidence to conclude that age distribution and location are not independent.
The following table shows age distribution and location of a random sample of 166 buffalo in a national park. Firehole District 17 16 26 59 Lamar District Nez Perce District 13 8 30 51 Row Total Age Calf 41 33 92 166 Use a chi-square test to determine if age distribution and location are independent at the 0.05 level of significance. 11 Yearling Adult 36 56 Column Total (a) What is the level of significance? State the null and alternate hypotheses. O H: Age distribution and location are not independent. H,: Age distribution and location are not independent. Ho: Age distribution and location are independent. H,: Age distribution and location are independent. O Ho: Age distribution and location are not independent. H: Age distribution and location are independent. O Ho: Age distribution and location are independent. H: Age distribution and location are not independent. (b) Find the value of the chi-square statistic for the sample. (Round the expected frequencies to at least three decimal places. Round the test statistic to three decimal places.) Are all the expected frequencies greater than 5? O Yes O No What sampling distribution will you use? O binomial O uniform normal O chi-square O Student's t What are the degrees of freedom? (c) Find or estimate the P-value of the sample test statistic. (Round your answer to three decimal places.) (d) Based on your answers in parts (a) to (c), will you reject or fail to reject the null hypothesis of independence? O Since the P-value > «, we fail to reject the null hypothesis. s. O Since the P-value > x, we reject the null hypothesis. Since the P-value s x, we reject the null hypothesis. Since the P-value s x, we fail to reject the null hypothesis. (e) Interpret your conclusion in the context of the application. O At the 5% level of significance, there is sufficient evidence to conclude that age distribution and location are not independent. O At the 5% level of significance, there is insufficient evidence to conclude that age distribution and location are not independent.

College Algebra (MindTap Course List)
12th Edition
ISBN:9781305652231
Author:R. David Gustafson, Jeff Hughes
Publisher:R. David Gustafson, Jeff Hughes
Chapter8: Sequences, Series, And Probability
Section8.7: Probability
Problem 5E: List the sample space of each experiment. Rolling one die and tossing one coin

Related questions
Topic Video
Question
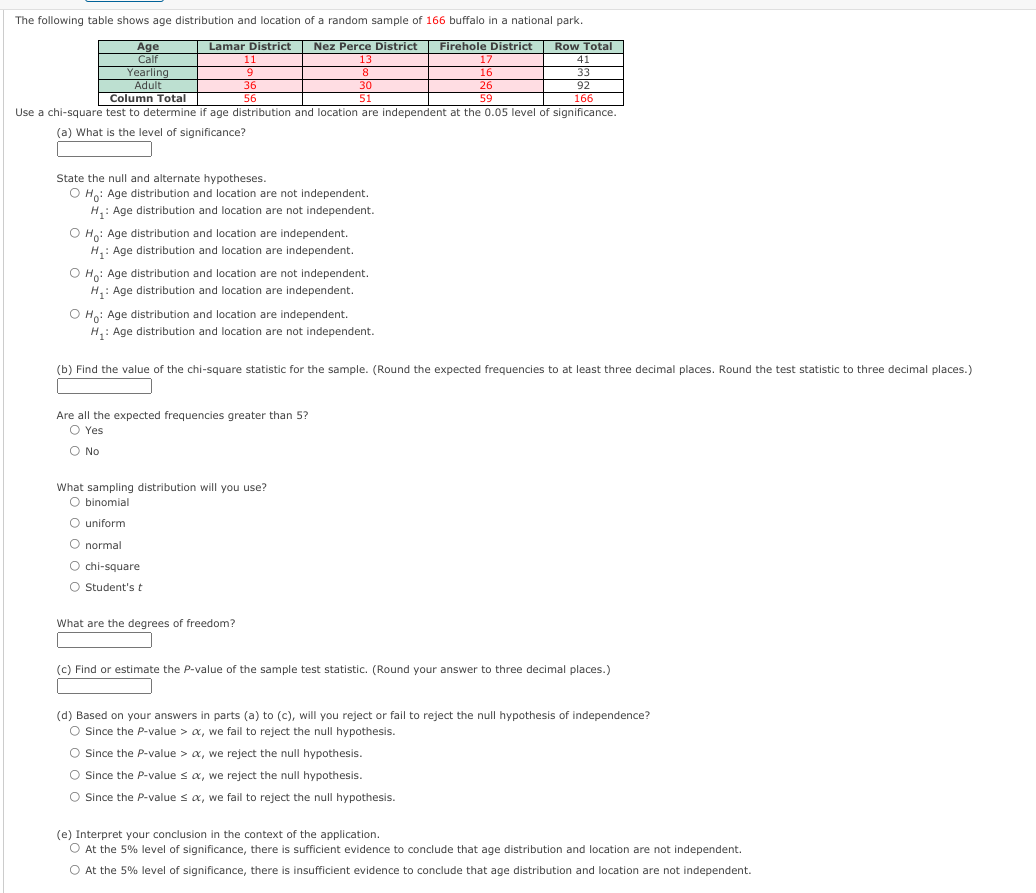
Transcribed Image Text:The following table shows age distribution and location of a random sample of 166 buffalo in a national park.
Nez Perce District
Firehole District
Age
Calf
Yearling
Row Total
41
33
92
Lamar District
11
13
17
9
8.
16
Adult
36
30
26
Column Total
56
51
59
166
Use a chi-square test to determine if age distribution and location are independent at the 0.05 level of significance.
(a) What is the level of significance?
State the null and alternate hypotheses.
O Ho: Age distribution and location are not independent.
H: Age distribution and location are not independent.
O Ho: Age distribution and location are independent.
H: Age distribution and location are independent.
O H: Age distribution and location are not independent.
H,: Age distribution and location are independent.
O H,: Age distribution and location are independent.
H,: Age distribution and location are not independent.
(b) Find the value of the chi-square statistic for the sample. (Round the expected frequencies to at least three decimal places. Round the test statistic to three decimal places.)
Are all the expected frequencies greater than 5?
O Yes
O No
What sampling distribution will you use?
O binomial
O uniform
O normal
O chi-square
O Student'st
What are the degrees of freedom?
(c) Find or estimate the P-value of the sample test statistic. (Round your answer to three decimal places.)
(d) Based on your answers in parts (a) to (c), will you reject or fail to reject the null hypothesis of independence?
O Since the P-value > x, we fail to reject the null hypothesis.
O Since the P-value > a, we reject the null hypothesis.
O Since the P-value s a, we reject the null hypothesis.
O Since the P-value s a, we fail to reject the null hypothesis.
(e) Interpret your conclusion in the context of the application.
O At the 5% level of significance, there is sufficient evidence to conclude that age distribution and location are not independent.
O At the 5% level of significance, there is insufficient evidence to conclude that age distribution and location are not independent.
Expert Solution
This question has been solved!
Explore an expertly crafted, step-by-step solution for a thorough understanding of key concepts.

Step by step
Solved in 3 steps with 5 images

Knowledge Booster


Learn more about
Need a deep-dive on the concept behind this application? Look no further. Learn more about this topic, statistics and related others by exploring similar questions and additional content below.Recommended textbooks for you
College Algebra (MindTap Course List)
Algebra
ISBN:
9781305652231
Author:
R. David Gustafson, Jeff Hughes
Publisher:
Cengage Learning
College Algebra (MindTap Course List)
Algebra
ISBN:
9781305652231
Author:
R. David Gustafson, Jeff Hughes
Publisher:
Cengage Learning