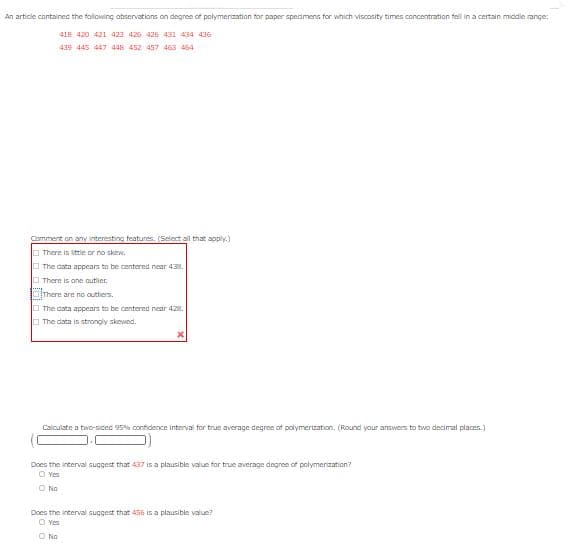
An article cantained the folowing ohservations on degree of polymerzatian for paper speaimens for which viscosity timets cnncentration fell in a certain middle range: 4IN 420 421 423 426 420 431 434 416 419 445 447 4a 452 457 463 464


Q: Use Simpson's Rule and all the data in the following table to estimate the value of the 10 integral…
A: Simpsons rule
Q: An assemb ly-line worker at Joseph Milner'sFabrication Shop inserts Pa rt A into Part B. A time…
A: Given: Result, x 8.4 8.6 8.3 8.5 8.7 8.5
Q: 1. Find the average value of f(x) = „ on [0, 1].
A: Topic = Application of integraion
Q: Find the average value gave of the function g on the given interval. g(x) = 5/x, [27, 125] gave %D
A:
Q: 27 Use Simpson's Rule and all the data in the following table to estimate the value of the integral…
A:
Q: . Consider a laboratory experiment in which three different chemicals were added to culti ourpose of…
A:
Q: Find the average value of ƒ(x) = mx + b over [-1, 1]
A:
Q: Let X and Y equal the hardness of the hot and cold water, respectively, in a campus building.…
A: a). Sample means:…
Q: Find the average value gave of the functiong on the given interval. g(x) = 3x, [8, 64] gave %3D
A:
Q: The following values of saturation drain current ( lo, sat ) were collected from several test wafers…
A:
Q: The adhesion resistance of 12 energetic materials (explosives, fuels and pyrotechnic compositions)…
A: a) For the given sample values, Mean=213, obtained from the Excel function, =AVERAGE(P1:P12)…
Q: Find the average value over the given interval. y = x "; [2, 8] O gn+1 - 2n+1 6(n+1) O gn+1_ 2n+1…
A:
Q: The following data are the numbers of cycles to failure of aluminum test coupons subjected epeated…
A: Given:
Q: Find the average value of the function on the giveninterval. g(x) = 3√x ,[1,8]
A:
Q: S(x) = x', [0,4]
A: Given average of function
Q: The accompanying data on cube compressive strength (MPa) of concrete specimens appeared in the…
A: * SOLUTION :- (B)
Q: Find the average value gave of the function g on the given interval. g(x) = 9x, [27, 125] %3D gave…
A:
Q: Flexural strength is a measure of a material's ability to resist failure in bending. The…
A: The 27 given values are 5.6, 7.2, 7.3, 6.3, 8.1, 6.8, 7.0, 7.6, 6.8, 6.5, 7.0, 6.3, 7.9, 9.0, 8.2,…
Q: Find the average value of 1/x on the closed interval [1,4] O A. In 4 О В. 4 In 4 О с. 13 O D. 1/3 In…
A: Given that
Q: The following data in Table Q6(b) are the numbers of cycles to failure of (b) aluminum test coupons…
A: data:…
Q: trength is a measure of a material's ability to resist failure in bending. The accompanying data are…
A: Observe the given data on flexural strength of concrete (in MegaPascal, MPa).
Q: Let /(t) [1,3] a) Find the average value on the given interval.
A:
Q: An artide contained the folloving observations on degree of polymerization for paper specimens for…
A: Note: As per our company guidelines we are supposed to answer only first three sub-parts. Kindly…
Q: Find the average value of æ on the interval 0, 4| O 16 O 64
A:
Q: Data on pull-off force (pounds) for connectors used in an automobile engine application are as…
A: d) Point estimate of the population standard deviation: The point estimate of the population…
Q: Each hour, a 10 m² section of fabric is inspected for flaws. The numbers of flaws observed for the…
A: a). The data represents the number of flaws for the last 20 hours of inspecting fabric.
Q: this process and known to follow a normal ifferent etching solutions have been compare- m samples of…
A: *Answer:
Q: + An article in the Australian Journal of Agricultural rch [“Non-Starch Polysaccharides and Broiler…
A: Note: Hi there! Thank you for posting the question. As your question has more than 3 parts, we have…
Q: Flexural strength Is a measure of a material's ability to resist failure in bending. The…
A: Note: As per my policy i can answer only three sub parts. kindly repost the remaining sub parts…
Q: A firm is investigating the formulation of synthetic fibres used to make cloth. The results from…
A: Null Hypothesis: H0: There is no difference in the overall strength of the cloth between the five…
Q: How many observations are collected for temperature interval of [24.5, 42.5) in the summarized data…
A: From the graph We have to calculate no. Of observations for temperature interval of [24.5,42.5]…
Q: Find the average value gave of the function g on the given interval.
A:
Q: In experiments to determine the effectiveness of drugs such as anti-fungal ointments that are…
A:
Q: A study was made on the amount of converted sugar in a certain process at various temperatu…
A: The given data is as follows The formula for SSxy=∑xy-∑x∑yn Te11mperature x Converted sugar y xy…
Q: Use Simpson's Rule and all the data in the following table to estimate the value of the 15 integral…
A: We have to find value of integral by Simpson's rule.
Q: Consider the following summary data on the modulus of elasticity (x 106 psi) for lumber of three…
A:
Q: Find the cardiac output using Simpson's rule if 4-mg of dye in injected into the right atrium and…
A:
Q: rofessional baseball players gave the following information. lable that represents the percentage of…
A: "Since you have posted a question with multiple sub-parts, we will solve first three sub-parts for…
Q: Flexural strength is a measure of a material's ability to resist failure in bending. The…
A: " Since you have posted a question with multiple sub-parts, we will solve the first three subparts…
Q: Consider a gas in a piston-cylinder device in which the temperature is held constant. As the volume…
A:
Q: Use Simpson's Rule and all the data in the following table to estimate the value of the integral 35…
A:
Q: No-fines concrete, made from e uniformly graded coerse eggregate and a cement-water paste, is…
A: AS per our guidelines we are suppose to do only one question
Q: 2. Find the average Let Value of f on the interval [o,1]
A:
Q: Let X denote the vibratory stress (psi) on a wind turbine blade at a particular wind speed in a wind…
A: Note: Hi there! Thank you for posting the question. As your question has more than 3 parts, we have…
Q: The Federal Aviation Administration requires material used to make evacuation systems retain their…
A: Consider µD = µB - µA = 0 which indicates the difference in mean tensile strength of polymer-coated…
Q: Flexural strength is a measure of a material's ability to resist failure in bending. The…
A:
Q: A repeatability test on a vortex flowmeter yielded the following 35 values of frequency…
A: Since you have posted a question with multiple subparts, we will solve first three subparts for you.…
Q: Find the average value gave of the function g on the given interval. g(x) = 2{x, [8, 27] gave
A: To find the average value of the given functions The average value of a function f(x) over a…
Q: The data presented in the following table give the tensile strength in psi (y) of paper as a…
A:

Step by step
Solved in 5 steps with 1 images

- An article contained the following observations on degree of polymerization for paper specimens for which viscosity times concentration fell in a certain middle range: 416 421 422 423 426 428 430 434 437 439 446 447 449 453 456 462 464 Comment on any interesting features. (Select all that apply.) ___The data appears to be centered near 438. ___There are no outliers. ___There is little or no skew. ___There is one outlier. ___The data is strongly skewed. ___The data appears to be centered near 428 Calculate a two-sided 95% confidence interval for true average degree of polymerization. (Round your answers to two decimal places.) (____, ____)The spike stature of the plants grown from the seeds of the porcine separates (Dactylis glomerata L) collected from the University campus and İbradı Eynif pasture are given below. In this plant, compare whether there is a difference between regions in terms of spike height. Virgo Height (cm) Data obtained from plants collected from university campus 5 6 8 7 8 6 5 5 4 6 6 Data obtained from plants collected from Eynif pasture 12 9 11 9 9 11 9 10 11 10 Note: Your results interpretation according to two different possibilities (Do it separately, assuming that it is 0.07 and 0.04).Consider the accompanying data on flexural strength (MPa) for concrete beams of a certain type. 5.3 7.2 7.3 6.3 8.1 6.8 7.0 7.1 6.8 6.5 7.0 6.3 7.9 9.0 9.0 8.7 7.8 9.7 7.4 7.7 9.7 7.9 7.7 11.6 11.3 11.8 10.7 The data below give accompanying strength observations for cylinders. 6.8 5.8 7.8 7.1 7.2 9.2 6.6 8.3 7.0 9.0 7.6 8.1 7.4 8.5 8.9 9.8 9.7 14.1 12.6 11.8 Prior to obtaining data, denote the beam strengths by X1, . . . , Xm and the cylinder strengths by Y1, . . . , Yn. Suppose that the Xi's constitute a random sample from a distribution with mean ?1 and standard deviation ?1 and that the Yi's form a random sample (independent of the Xi's) from another distribution with mean ?2 and standard deviation ?2. (a) Calculate the estimate for the given data. (Round your answer to three decimal places.) (b) Use rules of variance to obtain an expression for the variance and standard deviation (standard error) of the estimator in part (a). V(X − Y) = V(X) + V(Y) =…
- Consider the accompanying data on flexural strength (MPa) for concrete beams of a certain type. 5.5 7.2 7.3 6.3 8.1 6.8 7.0 7.2 6.8 6.5 7.0 6.3 7.9 9.0 8.7 8.7 7.8 9.7 7.4 7.7 9.7 8.0 7.7 11.6 11.3 11.8 10.7 The data below give accompanying strength observations for cylinders. 6.6 5.8 7.8 7.1 7.2 9.2 6.6 8.3 7.0 8.4 7.3 8.1 7.4 8.5 8.9 9.8 9.7 14.1 12.6 11.3 Prior to obtaining data, denote the beam strengths by X1, . . . , Xm and the cylinder strengths by Y1, . . . , Yn. Suppose that the Xi's constitute a random sample from a distribution with mean μ1 and standard deviation σ1 and that the Yi's form a random sample (independent of the Xi's) from another distribution with mean μ2 and standard deviation σ2. Compute the estimated standard error. (Round your answer to three decimal places.) (c) Calculate a point estimate of the ratio σ1/σ2 of the two standard deviations. (Round your answer to three decimal places.) (d) Suppose a single beam and a single cylinder are…The data given is shown below 40 40 43 46 44 49 51 54 46 51 47 49 49 45 45 44 45 41 49 52 51 54 50 51 41 52 53 50 46 56 42 42 40 42 49 47 51 48 46 57 48 55 49 46 57 44 49 43 44 43 51 48 48 46 49 Class width = 6 Find the following: A. Decile (5th) B. Quartile (2nd) C. Skewness D. KurtosisConsider the following information on ultimate tensile strength (lb/in) for a sample of n = 4 hard zirconium copper wire specimens (from “Characterization Methods for Fine Copper Wire,” Wire J. Intl., Aug., 1997: 74-80): X (bar)= 76,831 s = 180 smallest xi = 76,683 largest xi = 77,048Determine the values of the two middle sample observations (and don’t do it by successive guessing!).
- Suppose the proportion X of surface area in a randomly selected quadrat that is covered by a certain plant has a standard beta distribution with ? = 4 and ? = 2. (a) Compute E(X) and V(X). (Round your answers to four decimal places.) E(X) = V(X) = (b) Compute P(X ≤ 0.3). (Round your answer to four decimal places.)(c) Compute P(0.3 ≤ X ≤ 0.7). (Round your answer to four decimal places.)Use the following data to determine if drug B produces higher creatinine levels than drug A, assume the data is normally distributed. Creatinine levels (µmol/L) Drug A Drug B 48.2 52.3 54.6 57.4 58.3 55.6 47.8 53.2 51.4 61.3 52.0 58.0 55.2 59.8 49.1 54.8 49.9 52.6 Write out the null and alternative hypothesis in *words and symbols*. What is the hypothesis in words? Determine the critical value (use a significance level of 0.05) Calculate the test statistic, and determine if the results are significant or not. How did you calculate the standard deviations? Please provide a complete outline of calculationsLet ?1 denote true average tread life for a premium brand of P205/65R15 radial tire, and let ?2 denote the true average tread life for an economy brand of the same size. Test H0: ?1 − ?2 = 5000 versus Ha: ?1 − ?2 > 5000 at level 0.01, using the following data: m = 45, x = 42,100, s1 = 2400, n = 45, y = 36,200, and s2 = 1800.Calculate the test statistic and determine the P-value. (Round your test statistic to two decimal places and your P-value to four decimal places.) z = P-value = State the conclusion in the problem context. Fail to reject H0. The data does not suggest that the difference in average tread life exceeds 5000.Reject H0. The data suggests that the difference in average tread life exceeds 5000. Fail to reject H0. The data suggests that the difference in average tread life exceeds 5000.Reject H0. The data does not suggest that the difference in average tread life exceeds 5000.
- Let ?1 denote true average tread life for a premium brand of P205/65R15 radial tire, and let ?2 denote the true average tread life for an economy brand of the same size. Test H0: ?1 − ?2 = 5000 versus Ha: ?1 − ?2 > 5000 at level 0.01, using the following data: m = 45, x = 42,100, s1 = 2400, n = 45, y = 36,200, and s2 = 1800. Calculate the test statistic and determine the P-value. (Round your test statistic to two decimal places and your P-value to four decimal places.) z = P-value = State the conclusion in the problem context. Fail to reject H0. The data does not suggest that the difference in average tread life exceeds 5000.Reject H0. The data suggests that the difference in average tread life exceeds 5000. Fail to reject H0. The data suggests that the difference in average tread life exceeds 5000.Reject H0. The data does not suggest that the difference in average tread life exceeds 5000.Periodically, the county Water Department tests the drinking water of homeowners for contaminants such as lead and copper. The lead and copper levels in water specimens collected in 1998 for a sample of 10 residents of a subdevelopement of the county are shown below. lead (μμg/L) copper (mg/L) 4.44.4 0.6430.643 2.42.4 0.570.57 1.51.5 0.460.46 2.62.6 0.8950.895 5.95.9 0.20.2 3.43.4 0.540.54 3.83.8 0.2450.245 1.61.6 0.5830.583 5.75.7 0.7690.769 1.71.7 0.2150.215 (a) Construct a 9999% confidence interval for the mean lead level in water specimans of the subdevelopment. ≤μ≤≤μ≤ (b) Construct a 9999% confidence interval for the mean copper level in water specimans of the subdevelopment. ≤μ≤≤μ≤) The following table shows 10 communities ranked by decayed, missing, or filled (DMF) teeth per 100 children and fluoride concentration in ppm in the public water supply: Rank by DMF Teeth FluorideCommunity per 100 children X Concentration Y 1 8 1 2 9 3 3 7 4 4 3 9 5 2 8 6 4 77 1…