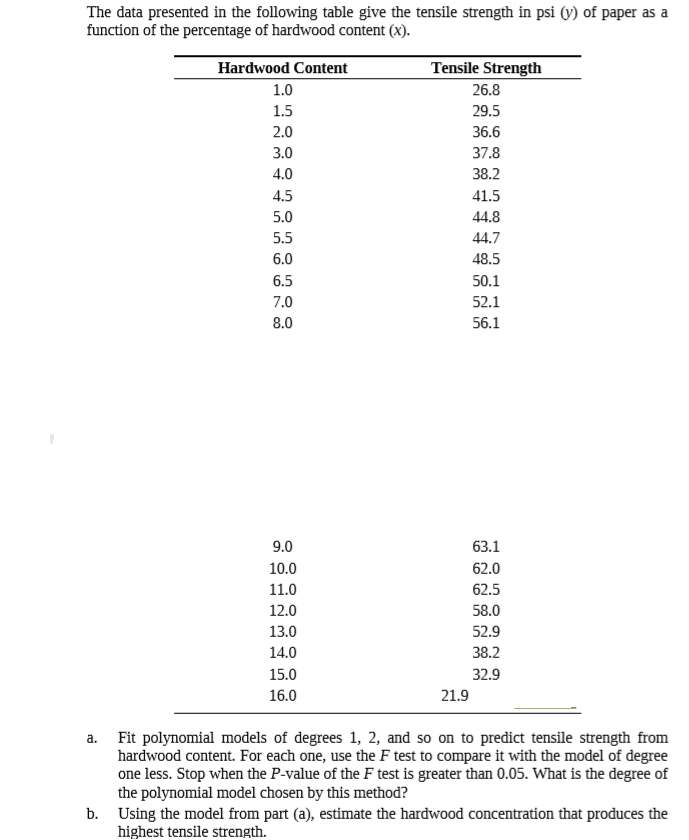
The data presented in the following table give the tensile strength in psi (y) of paper as a function of the percentage of hardwood content (x). Hardwood Content Tensile Strength 1.0 26.8 1.5 29.5 2.0 36.6 3.0 37.8 4.0 38.2 4.5 41.5 5.0 44.8 5.5 44.7 6.0 48.5 6.5 50.1 7.0 52.1 8.0 56.1 9.0 63.1 10.0 62.0 11.0 62.5 12.0 58.0 13.0 52.9 14.0 38.2 15.0 32.9 16.0 21.9 a. Fit polynomial models of degrees 1, 2, and so on to predict tensile strength from hardwood content. For each one, use the F test to compare it with the model of degree one less. Stop when the P-value of the F test is greater than 0.05. What is the degree of the polynomial model chosen by this method? b. Using the model from part (a), estimate the hardwood concentration that produces the highest tensile strength.
The data presented in the following table give the tensile strength in psi (y) of paper as a function of the percentage of hardwood content (x). Hardwood Content Tensile Strength 1.0 26.8 1.5 29.5 2.0 36.6 3.0 37.8 4.0 38.2 4.5 41.5 5.0 44.8 5.5 44.7 6.0 48.5 6.5 50.1 7.0 52.1 8.0 56.1 9.0 63.1 10.0 62.0 11.0 62.5 12.0 58.0 13.0 52.9 14.0 38.2 15.0 32.9 16.0 21.9 a. Fit polynomial models of degrees 1, 2, and so on to predict tensile strength from hardwood content. For each one, use the F test to compare it with the model of degree one less. Stop when the P-value of the F test is greater than 0.05. What is the degree of the polynomial model chosen by this method? b. Using the model from part (a), estimate the hardwood concentration that produces the highest tensile strength.

College Algebra
7th Edition
ISBN:9781305115545
Author:James Stewart, Lothar Redlin, Saleem Watson
Publisher:James Stewart, Lothar Redlin, Saleem Watson
Chapter2: Functions
Section: Chapter Questions
Problem 9CC

Related questions
Question
Transcribed Image Text:The data presented in the following table give the tensile strength in psi (y) of paper as a
function of the percentage of hardwood content (x).
Hardwood Content
Tensile Strength
1.0
26.8
1.5
29.5
2.0
36.6
3.0
37.8
4.0
38.2
4.5
41.5
5.0
44.8
5.5
44.7
6.0
48.5
6.5
50.1
7.0
52.1
8.0
56.1
9.0
63.1
10.0
62.0
11.0
62.5
12.0
58.0
13.0
52.9
14.0
38.2
15.0
32.9
16.0
21.9
a. Fit polynomial models of degrees 1, 2, and so on to predict tensile strength from
hardwood content. For each one, use the F test to compare it with the model of degree
one less. Stop when the P-value of the F test is greater than 0.05. What is the degree of
the polynomial model chosen by this method?
b. Using the model from part (a), estimate the hardwood concentration that produces the
highest tensile strength.
Expert Solution
This question has been solved!
Explore an expertly crafted, step-by-step solution for a thorough understanding of key concepts.

This is a popular solution!

Trending now
This is a popular solution!

Step by step
Solved in 5 steps with 16 images

Recommended textbooks for you
College Algebra
Algebra
ISBN:
9781305115545
Author:
James Stewart, Lothar Redlin, Saleem Watson
Publisher:
Cengage Learning
College Algebra
Algebra
ISBN:
9781305115545
Author:
James Stewart, Lothar Redlin, Saleem Watson
Publisher:
Cengage Learning