An article described an experiment in which observations on various characteristics were made using minichambers of three different types: (1) cooler (PVC frames covered with shade cloth), (2) control (PVC frames only), and (3) warmer (PVC frames covered with plastic). One of the article's authors kindly supplied the accompanying data on the difference between air and soil temperatures (°C). Cooler Control Warmer 1.59 1.92 2.57 1.43 2.00 2.60 1.88 2.19 1.93 1.26 1.12 1.58 1.91 1.78 2.30 1.86 1.84 0.84 1.90 2.45 2.65 1.57 2.03 0.07 1.79 1.52 2.74 1.72 0.52 2.53 2.41 1.90 2.13 2.34 2.86 0.87 2.31 1.34 1.91 1.76 (a) Compare measures of center for the three different samples. Cooler Control Warmer (b) Calculate the standard deviations for the three different samples. (Round your answers to three decimal places.) Cooler Control Warmer S = Interpret and compare the standard deviations for the three different samples. O we see from the standard deviations that variability increases as the conditions of the minichambers transition from warmer to cooler. O we see from the standard deviations that variability increases as the conditions of the minichambers transition from cooler to warmer. O we see from the standard deviations that variability increases when the conditions of of the mini-chambers transitions from the cooler to the control and decreases when the conditions transition from the control to warmer. O we see from the standard deviations that variability decreases as the conditions of the minichambers transition from cooler to warmer. O we see from the standard deviations that there is no difference in variability between the three conditions.
An article described an experiment in which observations on various characteristics were made using minichambers of three different types: (1) cooler (PVC frames covered with shade cloth), (2) control (PVC frames only), and (3) warmer (PVC frames covered with plastic). One of the article's authors kindly supplied the accompanying data on the difference between air and soil temperatures (°C). Cooler Control Warmer 1.59 1.92 2.57 1.43 2.00 2.60 1.88 2.19 1.93 1.26 1.12 1.58 1.91 1.78 2.30 1.86 1.84 0.84 1.90 2.45 2.65 1.57 2.03 0.07 1.79 1.52 2.74 1.72 0.52 2.53 2.41 1.90 2.13 2.34 2.86 0.87 2.31 1.34 1.91 1.76 (a) Compare measures of center for the three different samples. Cooler Control Warmer (b) Calculate the standard deviations for the three different samples. (Round your answers to three decimal places.) Cooler Control Warmer S = Interpret and compare the standard deviations for the three different samples. O we see from the standard deviations that variability increases as the conditions of the minichambers transition from warmer to cooler. O we see from the standard deviations that variability increases as the conditions of the minichambers transition from cooler to warmer. O we see from the standard deviations that variability increases when the conditions of of the mini-chambers transitions from the cooler to the control and decreases when the conditions transition from the control to warmer. O we see from the standard deviations that variability decreases as the conditions of the minichambers transition from cooler to warmer. O we see from the standard deviations that there is no difference in variability between the three conditions.

MATLAB: An Introduction with Applications
6th Edition
ISBN:9781119256830
Author:Amos Gilat
Publisher:Amos Gilat
Chapter1: Starting With Matlab
Section: Chapter Questions
Problem 1P

Related questions

Question
100%
Please solve the (b) only in the screenshot and show all work!
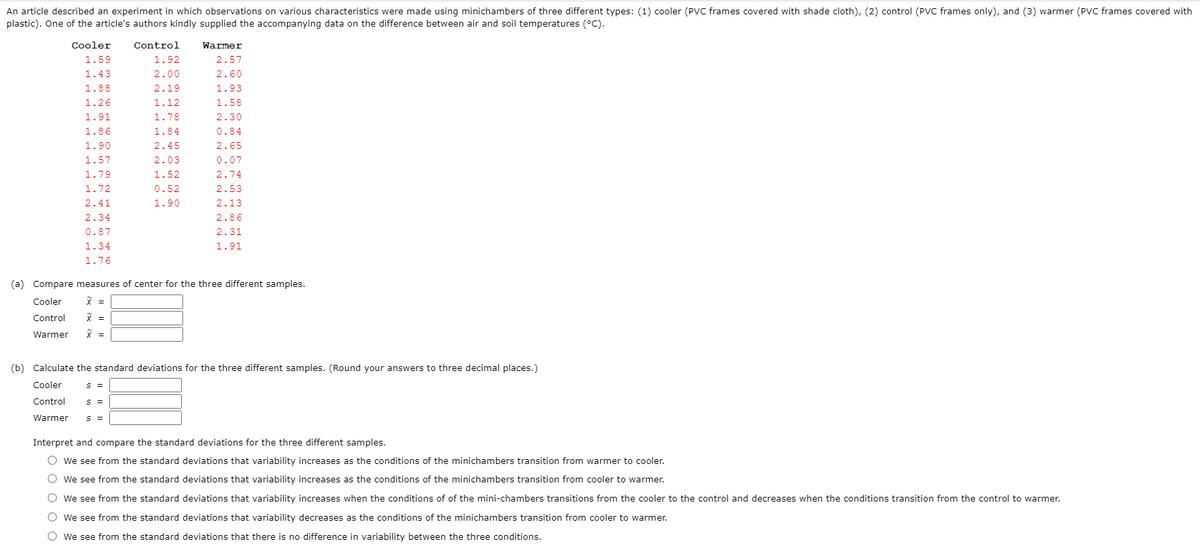
Transcribed Image Text:An article described an experiment in which observations on various characteristics were made using minichambers of three different types: (1) cooler (PvC frames covered with shade cloth), (2) control (PVC frames only), and (3) warmer (PVC frames covered with
plastic). One of the article's authors kindly supplied the accompanying data on the difference between air and soil temperatures (°C).
Cooler
Control
Warmer
1.59
1.92
2.57
1.43
2.00
2.60
1.88
2.19
1.93
1.26
1.12
1.58
1.91
1.78
2.30
1.86
1.84
0.84
1.90
2.45
2.65
1.57
2.03
0.07
1.79
1.52
2.74
1.72
0.52
2.53
2.41
1.90
2.13
2.34
2.86
0.87
2.31
1.34
1.91
1.76
(a) Compare measures of center for the three different samples.
Cooler
X =
Control
Warmer
X =
(b) Calculate the standard deviations for the three different samples. (Round your answers to three decimal places.)
Cooler
S =
Control
S =
Warmer
S =
Interpret and compare the standard deviations for the three different samples.
O we see from the standard deviations that variability increases as the conditions of the minichambers transition from warmer to cooler.
O we see from the standard deviations that variability increases as the conditions of the minichambers transition from cooler to warmer.
O we see from the standard deviations that variability increases when the conditions of of the mini-chambers transitions from the cooler to the control and decreases when the conditions transition from the control to warmer.
O we see from the standard deviations that variability decreases as the conditions of the minichambers transition from cooler to warmer.
O we see from the standard deviations that there is no difference in variability between the three conditions.
Expert Solution
This question has been solved!
Explore an expertly crafted, step-by-step solution for a thorough understanding of key concepts.

This is a popular solution!

Trending now
This is a popular solution!

Step by step
Solved in 2 steps with 5 images

Knowledge Booster


Learn more about
Need a deep-dive on the concept behind this application? Look no further. Learn more about this topic, statistics and related others by exploring similar questions and additional content below.Recommended textbooks for you
MATLAB: An Introduction with Applications
Statistics
ISBN:
9781119256830
Author:
Amos Gilat
Publisher:
John Wiley & Sons Inc

Probability and Statistics for Engineering and th…
Statistics
ISBN:
9781305251809
Author:
Jay L. Devore
Publisher:
Cengage Learning

Statistics for The Behavioral Sciences (MindTap C…
Statistics
ISBN:
9781305504912
Author:
Frederick J Gravetter, Larry B. Wallnau
Publisher:
Cengage Learning
MATLAB: An Introduction with Applications
Statistics
ISBN:
9781119256830
Author:
Amos Gilat
Publisher:
John Wiley & Sons Inc
Probability and Statistics for Engineering and th…
Statistics
ISBN:
9781305251809
Author:
Jay L. Devore
Publisher:
Cengage Learning
Statistics for The Behavioral Sciences (MindTap C…
Statistics
ISBN:
9781305504912
Author:
Frederick J Gravetter, Larry B. Wallnau
Publisher:
Cengage Learning

Elementary Statistics: Picturing the World (7th E…
Statistics
ISBN:
9780134683416
Author:
Ron Larson, Betsy Farber
Publisher:
PEARSON

The Basic Practice of Statistics
Statistics
ISBN:
9781319042578
Author:
David S. Moore, William I. Notz, Michael A. Fligner
Publisher:
W. H. Freeman

Introduction to the Practice of Statistics
Statistics
ISBN:
9781319013387
Author:
David S. Moore, George P. McCabe, Bruce A. Craig
Publisher:
W. H. Freeman