An article in Concrete Research ("Near Surface Characteristics of Concrete: Intrinsic Permeability," Vol. 41, 1989), presented data on compressive strength x and intrinsic permeability y of various concrete mixes and cures. Summary quantities are n = 14, Ey; = 572, y = 23,530, Ex = 43, Ex? = 157.42, andEx;y, = 1697.80. Assume that the two variables are related according to the simple linear regression model.
An article in Concrete Research ("Near Surface Characteristics of Concrete: Intrinsic Permeability," Vol. 41, 1989), presented data on compressive strength x and intrinsic permeability y of various concrete mixes and cures. Summary quantities are n = 14, Ey; = 572, y = 23,530, Ex = 43, Ex? = 157.42, andEx;y, = 1697.80. Assume that the two variables are related according to the simple linear regression model.

MATLAB: An Introduction with Applications
6th Edition
ISBN:9781119256830
Author:Amos Gilat
Publisher:Amos Gilat
Chapter1: Starting With Matlab
Section: Chapter Questions
Problem 1P

Related questions
Question
2
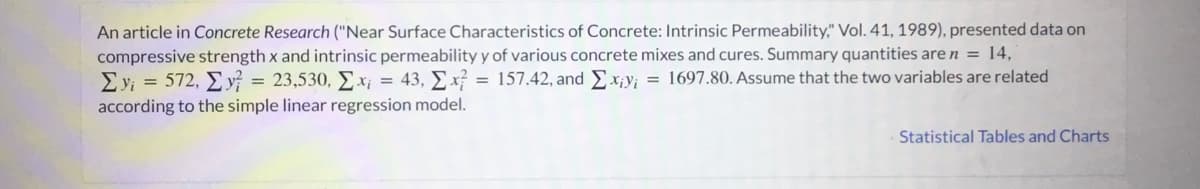
Transcribed Image Text:An article in Concrete Research ("Near Surface Characteristics of Concrete: Intrinsic Permeability," Vol. 41, 1989), presented data on
compressive strength x and intrinsic permeability y of various concrete mixes and cures. Summary quantities are n = 14,
Eyi = 572, y = 23,530, Ex¡ = 43, Ex = 157.42, andEx¡y; = 1697.80. Assume that the two variables are related
according to the simple linear regression model.
Statistical Tables and Charts

Transcribed Image Text:Calculate the least squares estimate of the intercept. (Round your answer to 3 decimal places.)
i
Expert Solution
This question has been solved!
Explore an expertly crafted, step-by-step solution for a thorough understanding of key concepts.

This is a popular solution!

Trending now
This is a popular solution!

Step by step
Solved in 2 steps with 2 images

Recommended textbooks for you
MATLAB: An Introduction with Applications
Statistics
ISBN:
9781119256830
Author:
Amos Gilat
Publisher:
John Wiley & Sons Inc

Probability and Statistics for Engineering and th…
Statistics
ISBN:
9781305251809
Author:
Jay L. Devore
Publisher:
Cengage Learning

Statistics for The Behavioral Sciences (MindTap C…
Statistics
ISBN:
9781305504912
Author:
Frederick J Gravetter, Larry B. Wallnau
Publisher:
Cengage Learning
MATLAB: An Introduction with Applications
Statistics
ISBN:
9781119256830
Author:
Amos Gilat
Publisher:
John Wiley & Sons Inc
Probability and Statistics for Engineering and th…
Statistics
ISBN:
9781305251809
Author:
Jay L. Devore
Publisher:
Cengage Learning
Statistics for The Behavioral Sciences (MindTap C…
Statistics
ISBN:
9781305504912
Author:
Frederick J Gravetter, Larry B. Wallnau
Publisher:
Cengage Learning

Elementary Statistics: Picturing the World (7th E…
Statistics
ISBN:
9780134683416
Author:
Ron Larson, Betsy Farber
Publisher:
PEARSON

The Basic Practice of Statistics
Statistics
ISBN:
9781319042578
Author:
David S. Moore, William I. Notz, Michael A. Fligner
Publisher:
W. H. Freeman

Introduction to the Practice of Statistics
Statistics
ISBN:
9781319013387
Author:
David S. Moore, George P. McCabe, Bruce A. Craig
Publisher:
W. H. Freeman