An article in Nature Genetics studied gene expression as a function of treatments for leukemia. One group received a high dose of the drug, while the control group received no treatment. Expression data (measures of gene activity) from one gene were measured for each group of patients and presented in the box plot. Which statement describes the best interpretation of data based on the box plot? Boxplot of High Dose, Control, Control_1, Control_2 3000- 2500 - 2000 1500 1000- High Dose Control Control 1 Control 2 Oa Those patients receiving high dose of the drug has the lowest measurement of gene activity O b. Patients under control group 2 has the highest mean and greatest dispersion OC All distribution are centered at about the same value but it's apparent that variances differ O d. Further data is needed for patients that received no treatment especially that variances differ as shown in control group 2 Data
An article in Nature Genetics studied gene expression as a function of treatments for leukemia. One group received a high dose of the drug, while the control group received no treatment. Expression data (measures of gene activity) from one gene were measured for each group of patients and presented in the box plot. Which statement describes the best interpretation of data based on the box plot? Boxplot of High Dose, Control, Control_1, Control_2 3000- 2500 - 2000 1500 1000- High Dose Control Control 1 Control 2 Oa Those patients receiving high dose of the drug has the lowest measurement of gene activity O b. Patients under control group 2 has the highest mean and greatest dispersion OC All distribution are centered at about the same value but it's apparent that variances differ O d. Further data is needed for patients that received no treatment especially that variances differ as shown in control group 2 Data

MATLAB: An Introduction with Applications
6th Edition
ISBN:9781119256830
Author:Amos Gilat
Publisher:Amos Gilat
Chapter1: Starting With Matlab
Section: Chapter Questions
Problem 1P

Related questions
Question
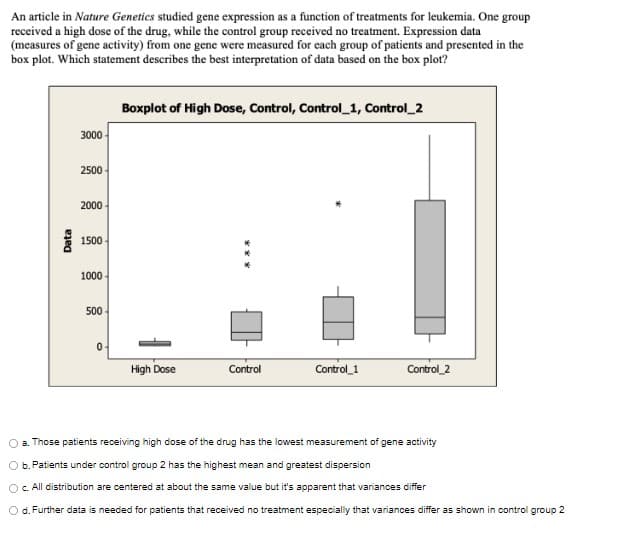
Transcribed Image Text:An article in Nature Genetics studied gene expression as a function of treatments for leukemia. One group
received a high dose of the drug, while the control group received no treatment. Expression data
(measures of gene activity) from one gene were measured for each group of patients and presented in the
box plot. Which statement describes the best interpretation of data based on the box plot?
Boxplot of High Dose, Control, Control_1, Control_2
3000 -
2500
2000
1500
1000
500
High Dose
Control_1
Control 2
Control
a. Those patients receiving high dose of the drug has the lowest measurement of gene activity
Ob. Patients under control group 2 has the highest mean and greatest dispersion
c. All distribution are centered at about the same value but it's apparent that variances differ
O d. Further data is needed for patients that received no treatment especially that variances differ as shown in control group 2
Data
Expert Solution
This question has been solved!
Explore an expertly crafted, step-by-step solution for a thorough understanding of key concepts.

This is a popular solution!

Trending now
This is a popular solution!

Step by step
Solved in 2 steps

Recommended textbooks for you
MATLAB: An Introduction with Applications
Statistics
ISBN:
9781119256830
Author:
Amos Gilat
Publisher:
John Wiley & Sons Inc

Probability and Statistics for Engineering and th…
Statistics
ISBN:
9781305251809
Author:
Jay L. Devore
Publisher:
Cengage Learning

Statistics for The Behavioral Sciences (MindTap C…
Statistics
ISBN:
9781305504912
Author:
Frederick J Gravetter, Larry B. Wallnau
Publisher:
Cengage Learning
MATLAB: An Introduction with Applications
Statistics
ISBN:
9781119256830
Author:
Amos Gilat
Publisher:
John Wiley & Sons Inc
Probability and Statistics for Engineering and th…
Statistics
ISBN:
9781305251809
Author:
Jay L. Devore
Publisher:
Cengage Learning
Statistics for The Behavioral Sciences (MindTap C…
Statistics
ISBN:
9781305504912
Author:
Frederick J Gravetter, Larry B. Wallnau
Publisher:
Cengage Learning

Elementary Statistics: Picturing the World (7th E…
Statistics
ISBN:
9780134683416
Author:
Ron Larson, Betsy Farber
Publisher:
PEARSON

The Basic Practice of Statistics
Statistics
ISBN:
9781319042578
Author:
David S. Moore, William I. Notz, Michael A. Fligner
Publisher:
W. H. Freeman

Introduction to the Practice of Statistics
Statistics
ISBN:
9781319013387
Author:
David S. Moore, George P. McCabe, Bruce A. Craig
Publisher:
W. H. Freeman