independently analyze and interpret the data. Compare the improved airplane performance (average flight time) with the baseline results d
independently analyze and interpret the data. Compare the improved airplane performance (average flight time) with the baseline results d

Glencoe Algebra 1, Student Edition, 9780079039897, 0079039898, 2018
18th Edition
ISBN:9780079039897
Author:Carter
Publisher:Carter
Chapter10: Statistics
Section10.4: Distributions Of Data
Problem 19PFA

Related questions
Question
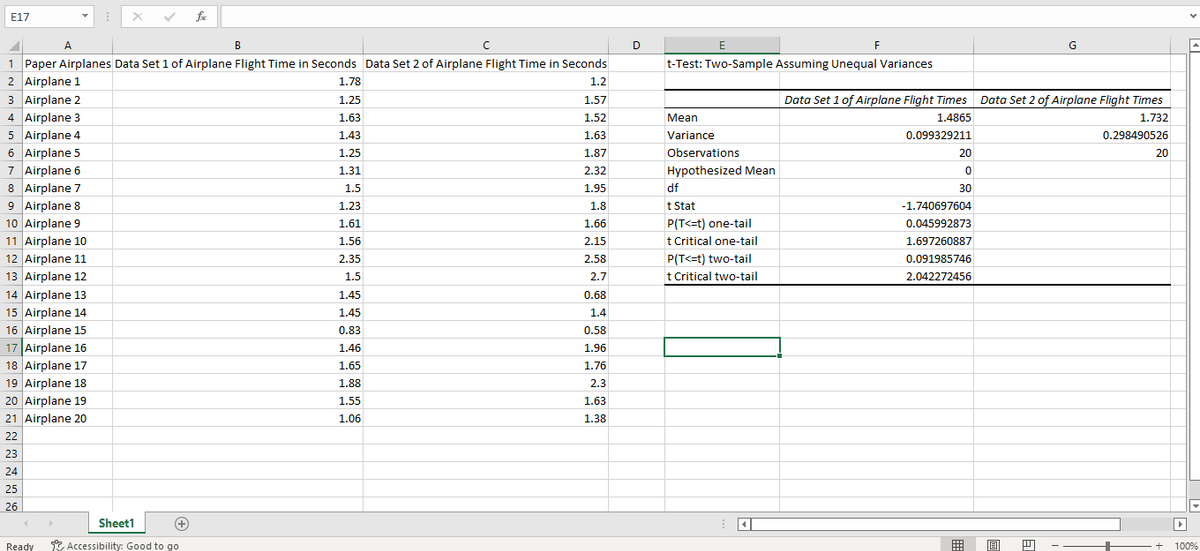
independently analyze and interpret the data. Compare the improved airplane performance (average flight time) with the baseline results determined.
Transcribed Image Text:E17
fe
A
B
D
E
1 Paper Airplanes Data Set 1 of Airplane Flight Time in Seconds Data Set 2 of Airplane Flight Time in Seconds
2 Airplane 1
3 Airplane 2
t-Test: Two-Sample Assuming Unequal Variances
1.78
1.2
1.25
1.57
Data Set 1 of Airplane Flight Times Data Set 2 of Airplane Flight Times
4 Airplane 3
5 Airplane 4
6 Airplane 5
7 Airplane 6
8 Airplane 7
9 Airplane 8
10 Airplane 9
11 Airplane 10
12 Airplane 11
13 Airplane 12
14 Airplane 13
15 Airplane 14
16 Airplane 15
1.63
1.52
Mean
1.4865
1.732
1.43
1.63
Variance
0.099329211
0.298490526
1.25
1.87
Observations
20
20
1.31
2.32
Hypothesized Mean
1.5
1.95
df
30
1.23
1.8
t Stat
-1.740697604
P(T<=t) one-tail
t Critical one-tail
1.61
1.66
0.045992873
1.56
2.15
1.697260887
2.35
2.58
P(T<=t) two-tail
0.091985746
1.5
2.7
t Critical two-tail
2.042272456
1.45
0.68
1.45
1.4
0.83
0.58
17 Airplane 16
18 Airplane 17
19 Airplane 18
20 Airplane 19
21 Airplane 20
1.46
1.96
1.65
1.76
1.88
2.3
1.55
1.63
1.06
1.38
22
23
24
25
26
Sheet1
Ready
* Accessibility: Good to go
100%
Expert Solution
This question has been solved!
Explore an expertly crafted, step-by-step solution for a thorough understanding of key concepts.

This is a popular solution!

Trending now
This is a popular solution!

Step by step
Solved in 2 steps

Recommended textbooks for you
Glencoe Algebra 1, Student Edition, 9780079039897…
Algebra
ISBN:
9780079039897
Author:
Carter
Publisher:
McGraw Hill
Glencoe Algebra 1, Student Edition, 9780079039897…
Algebra
ISBN:
9780079039897
Author:
Carter
Publisher:
McGraw Hill