An article in the Tappi Journal (March, 1986) presented data on green liquor Na2S concentration (in grams per liter) that is affected by paper ma production (in tons per day). 16. Fit a simple linear regression model. a.concentration =11.7 + 0.0386 production b.production =11.7 + 0.0386 concentration
An article in the Tappi Journal (March, 1986) presented data on green liquor Na2S concentration (in grams per liter) that is affected by paper ma production (in tons per day). 16. Fit a simple linear regression model. a.concentration =11.7 + 0.0386 production b.production =11.7 + 0.0386 concentration

Trigonometry (MindTap Course List)
8th Edition
ISBN:9781305652224
Author:Charles P. McKeague, Mark D. Turner
Publisher:Charles P. McKeague, Mark D. Turner
Chapter4: Graphing And Inverse Functions
Section: Chapter Questions
Problem 6GP: If your graphing calculator is capable of computing a least-squares sinusoidal regression model, use...

Related questions
Question
16. Using the given Minitab output, answer the questions that follow.
Transcribed Image Text:An article in the Tappi Journal (March, 1986) presented data on green liquor Na2S concentration (in grams per liter) that is affected by paper machine
production (in tons per day).
16. Fit a simple linear regression model.
a.concentration =11.7 + 0.0386 production
b.production =11.7 + 0.0386 concentration
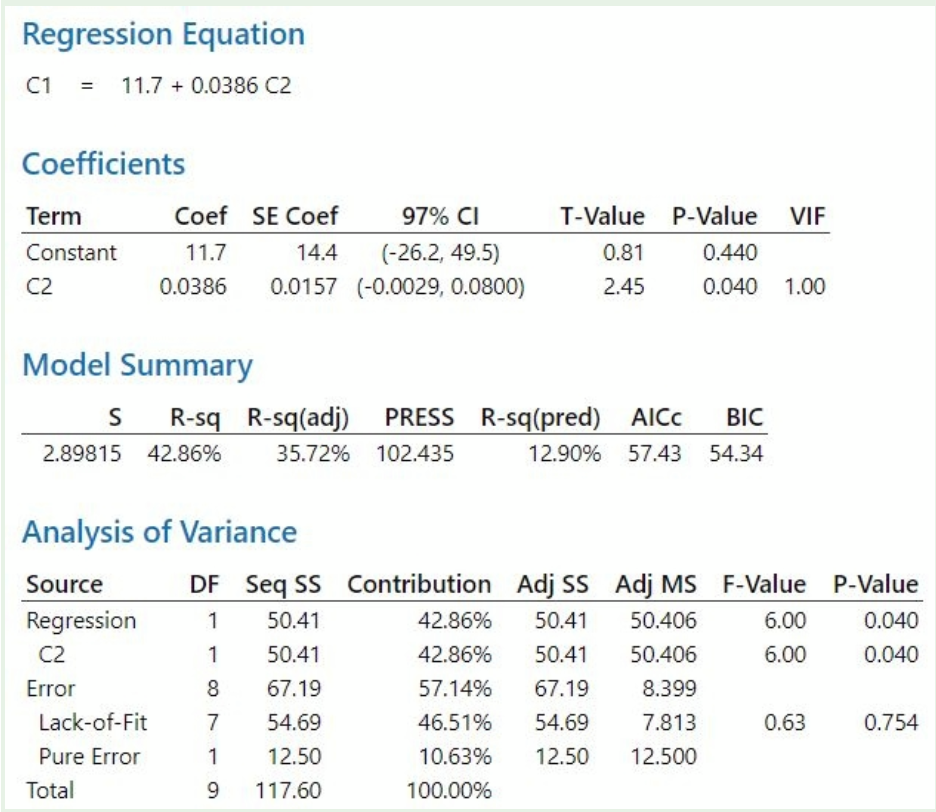
Transcribed Image Text:Regression Equation
C1 = 11.7 + 0.0386 C2
Coefficients
Term
Coef SE Coef
97% CI
T-Value P-Value VIF
Constant
11.7
14.4
(-26.2, 49.5)
0.81
0.440
C2
0.0386
0.0157 (-0.0029, 0.0800)
2.45
0.040 1.00
Model Summary
S
R-sq R-sq(adj)
PRESS R-sq(pred) AICC
BIC
2.89815 42.86%
35.72% 102.435
12.90% 57.43 54.34
Analysis of Variance
Source
DF Seq SS Contribution Adj SS Adj MS F-Value P-Value
Regression
C2
1
50.41
42.86%
50.41
50.406
6.00
0.040
1
50.41
42.86%
50.41
50.406
6.00
0.040
Error
8
67.19
57.14%
67.19
8.399
Lack-of-Fit
7
54.69
46.51%
54.69
7.813
0.63
0.754
Pure Error
1
12.50
10.63%
12.50
12.500
Total
9.
117.60
100.00%
Expert Solution
This question has been solved!
Explore an expertly crafted, step-by-step solution for a thorough understanding of key concepts.

Step by step
Solved in 2 steps with 2 images

Recommended textbooks for you
Trigonometry (MindTap Course List)
Trigonometry
ISBN:
9781305652224
Author:
Charles P. McKeague, Mark D. Turner
Publisher:
Cengage Learning

Functions and Change: A Modeling Approach to Coll…
Algebra
ISBN:
9781337111348
Author:
Bruce Crauder, Benny Evans, Alan Noell
Publisher:
Cengage Learning

Trigonometry (MindTap Course List)
Trigonometry
ISBN:
9781305652224
Author:
Charles P. McKeague, Mark D. Turner
Publisher:
Cengage Learning
Functions and Change: A Modeling Approach to Coll…
Algebra
ISBN:
9781337111348
Author:
Bruce Crauder, Benny Evans, Alan Noell
Publisher:
Cengage Learning

Algebra & Trigonometry with Analytic Geometry
Algebra
ISBN:
9781133382119
Author:
Swokowski
Publisher:
Cengage

College Algebra
Algebra
ISBN:
9781305115545
Author:
James Stewart, Lothar Redlin, Saleem Watson
Publisher:
Cengage Learning

Algebra and Trigonometry (MindTap Course List)
Algebra
ISBN:
9781305071742
Author:
James Stewart, Lothar Redlin, Saleem Watson
Publisher:
Cengage Learning