An artide in the IEEE Transactions on Components, Hybrids, and Manufacturing Technology (Vol. 15, No. 2, 1992, pp. 146-153) describes an experiment in which the contact resistance of a brake-only relay was studied for three different materials (all were silver-based alloys). The data are as follows: Contact Resistance Alloy 95 |97 ||99 |98 ||99 ||99 ||99 |94 ||95 | 98 104 102 102 105| 99 102 111 103 100 103 2 119 130 132 136 141 172 145 150 144 135 3 Calculate the test statistic fo (2 decimal places).
An artide in the IEEE Transactions on Components, Hybrids, and Manufacturing Technology (Vol. 15, No. 2, 1992, pp. 146-153) describes an experiment in which the contact resistance of a brake-only relay was studied for three different materials (all were silver-based alloys). The data are as follows: Contact Resistance Alloy 95 |97 ||99 |98 ||99 ||99 ||99 |94 ||95 | 98 104 102 102 105| 99 102 111 103 100 103 2 119 130 132 136 141 172 145 150 144 135 3 Calculate the test statistic fo (2 decimal places).

MATLAB: An Introduction with Applications
6th Edition
ISBN:9781119256830
Author:Amos Gilat
Publisher:Amos Gilat
Chapter1: Starting With Matlab
Section: Chapter Questions
Problem 1P

Related questions
Question
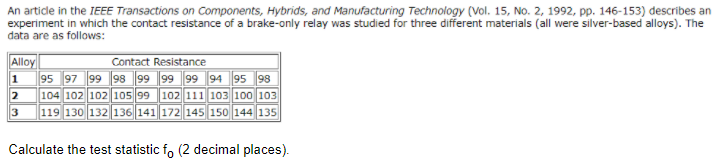
Transcribed Image Text:An article in the IEEE Transactions on Components, Hybrids, and Manufacturing Technology (Vol. 15, No. 2, 1992, pp. 146-153) describes an
experiment in which the contact resistance of a brake-only relay was studied for three different materials (all were silver-based alloys). The
data are as follows:
Alloy
1 95 97 99 98 99 99 99 94 95 98
2 104 102 102 105 99 102 111 103 100 103
119 130 132 136 141 172 145 150 144 135
Contact Resistance
Calculate the test statistic fo (2 decimal places).
Expert Solution
This question has been solved!
Explore an expertly crafted, step-by-step solution for a thorough understanding of key concepts.

Step by step
Solved in 2 steps with 2 images

Recommended textbooks for you
MATLAB: An Introduction with Applications
Statistics
ISBN:
9781119256830
Author:
Amos Gilat
Publisher:
John Wiley & Sons Inc

Probability and Statistics for Engineering and th…
Statistics
ISBN:
9781305251809
Author:
Jay L. Devore
Publisher:
Cengage Learning

Statistics for The Behavioral Sciences (MindTap C…
Statistics
ISBN:
9781305504912
Author:
Frederick J Gravetter, Larry B. Wallnau
Publisher:
Cengage Learning
MATLAB: An Introduction with Applications
Statistics
ISBN:
9781119256830
Author:
Amos Gilat
Publisher:
John Wiley & Sons Inc
Probability and Statistics for Engineering and th…
Statistics
ISBN:
9781305251809
Author:
Jay L. Devore
Publisher:
Cengage Learning
Statistics for The Behavioral Sciences (MindTap C…
Statistics
ISBN:
9781305504912
Author:
Frederick J Gravetter, Larry B. Wallnau
Publisher:
Cengage Learning

Elementary Statistics: Picturing the World (7th E…
Statistics
ISBN:
9780134683416
Author:
Ron Larson, Betsy Farber
Publisher:
PEARSON

The Basic Practice of Statistics
Statistics
ISBN:
9781319042578
Author:
David S. Moore, William I. Notz, Michael A. Fligner
Publisher:
W. H. Freeman

Introduction to the Practice of Statistics
Statistics
ISBN:
9781319013387
Author:
David S. Moore, George P. McCabe, Bruce A. Craig
Publisher:
W. H. Freeman