An automatic lathe produces rollers for roller bea is set at 8.60 and for the mean range at 0.22 mm. The process is in control, as established by samples of size 4. The upper and lower specifications rollers are (8.60+0.25) and (8.60-0.25) mm, respectively. Click the icon to view the table of factors for calculating three-sigma limits for the x-chart and R-chart. a. Calculate the control limits for the mean and range charts. The UCL equalsmm and the LCL equalsmm. (Enter your responses rounded to two decimal places.) the diameter of t
An automatic lathe produces rollers for roller bea is set at 8.60 and for the mean range at 0.22 mm. The process is in control, as established by samples of size 4. The upper and lower specifications rollers are (8.60+0.25) and (8.60-0.25) mm, respectively. Click the icon to view the table of factors for calculating three-sigma limits for the x-chart and R-chart. a. Calculate the control limits for the mean and range charts. The UCL equalsmm and the LCL equalsmm. (Enter your responses rounded to two decimal places.) the diameter of t

Glencoe Algebra 1, Student Edition, 9780079039897, 0079039898, 2018
18th Edition
ISBN:9780079039897
Author:Carter
Publisher:Carter
Chapter10: Statistics
Section: Chapter Questions
Problem 22SGR

Related questions
Question
please solve within 30 minutes.
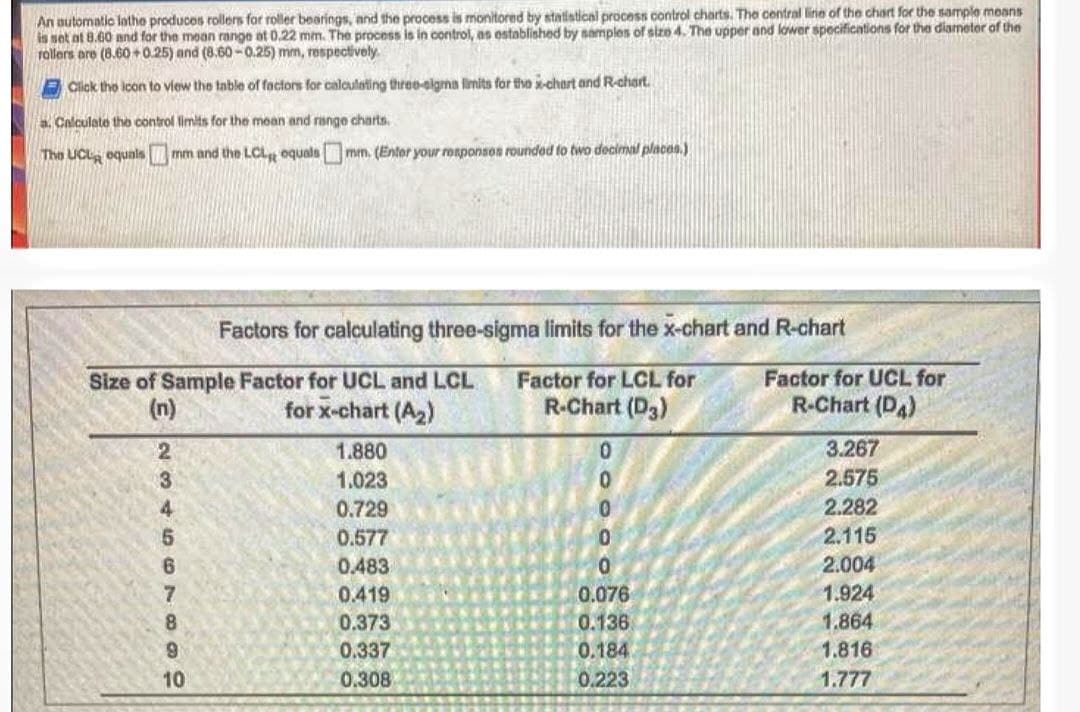
Transcribed Image Text:An automatic lathe produces rollers for roller bearings, and the process is monitored by statistical process control charts. The central line of the chart for the sample means
is set at 8.60 and for the mean range at 0.22 mm. The process is in control, as established by samples of size 4. The upper and lower specifications for the diameter of the
rollers are (8.60+0.25) and (8.60-0.25) mm, respectively.
Click the icon to view the table of factors for calculating three-sigma limits for the x-chart and R-chart.
a. Calculate the control limits for the mean and range charts.
The UCL equalsmm and the LCL equalsmm. (Enter your responses rounded to two decimal places.)
Size of Sample Factor for UCL and LCL
for x-chart (A₂)
2
677893566
4
Factors for calculating three-sigma limits for the x-chart and R-chart
Factor for LCL for
R-Chart (D3)
10
1.880
1.023
0.729
0.577
0.483
0.419
0.373
0.337
0.308
0
0
0
0
0.076
0.136
0.184
0.223
Factor for UCL for
R-Chart (D4)
3.267
2.575
2.282
2.115
2.004
1.924
1.864
1.816
1.777
Expert Solution
This question has been solved!
Explore an expertly crafted, step-by-step solution for a thorough understanding of key concepts.

Step by step
Solved in 2 steps

Recommended textbooks for you
Glencoe Algebra 1, Student Edition, 9780079039897…
Algebra
ISBN:
9780079039897
Author:
Carter
Publisher:
McGraw Hill
Glencoe Algebra 1, Student Edition, 9780079039897…
Algebra
ISBN:
9780079039897
Author:
Carter
Publisher:
McGraw Hill