The weights (in pounds) of 6 vehicles and the variability of their braking dista 6500 5100 5880 4800 Weight, x 5960 5330 Variability in 1.77 1.98 1.87 1.63 1.64 1.50 braking distance, y Click here to view a table of critical values for Student's t-distribution. Setup the hypothesis for the test. = Ho:p 0 dentify the critical value(s). Select the correct choice below and fill in an Round to three decimal places as needed.) A. The critical values are to = B. The critical value is and to Jimmi
The weights (in pounds) of 6 vehicles and the variability of their braking dista 6500 5100 5880 4800 Weight, x 5960 5330 Variability in 1.77 1.98 1.87 1.63 1.64 1.50 braking distance, y Click here to view a table of critical values for Student's t-distribution. Setup the hypothesis for the test. = Ho:p 0 dentify the critical value(s). Select the correct choice below and fill in an Round to three decimal places as needed.) A. The critical values are to = B. The critical value is and to Jimmi

MATLAB: An Introduction with Applications
6th Edition
ISBN:9781119256830
Author:Amos Gilat
Publisher:Amos Gilat
Chapter1: Starting With Matlab
Section: Chapter Questions
Problem 1P

Related questions
Question
The weights (in pounds) of 6 vehicles and the variability of their breaking distances (in feet) when stopping on a dry surface are shown in the table. Can you conclude that there is a significant linear correlation between vehicle weight and variability in braking distance on a dry surface?
Identify the critical values.
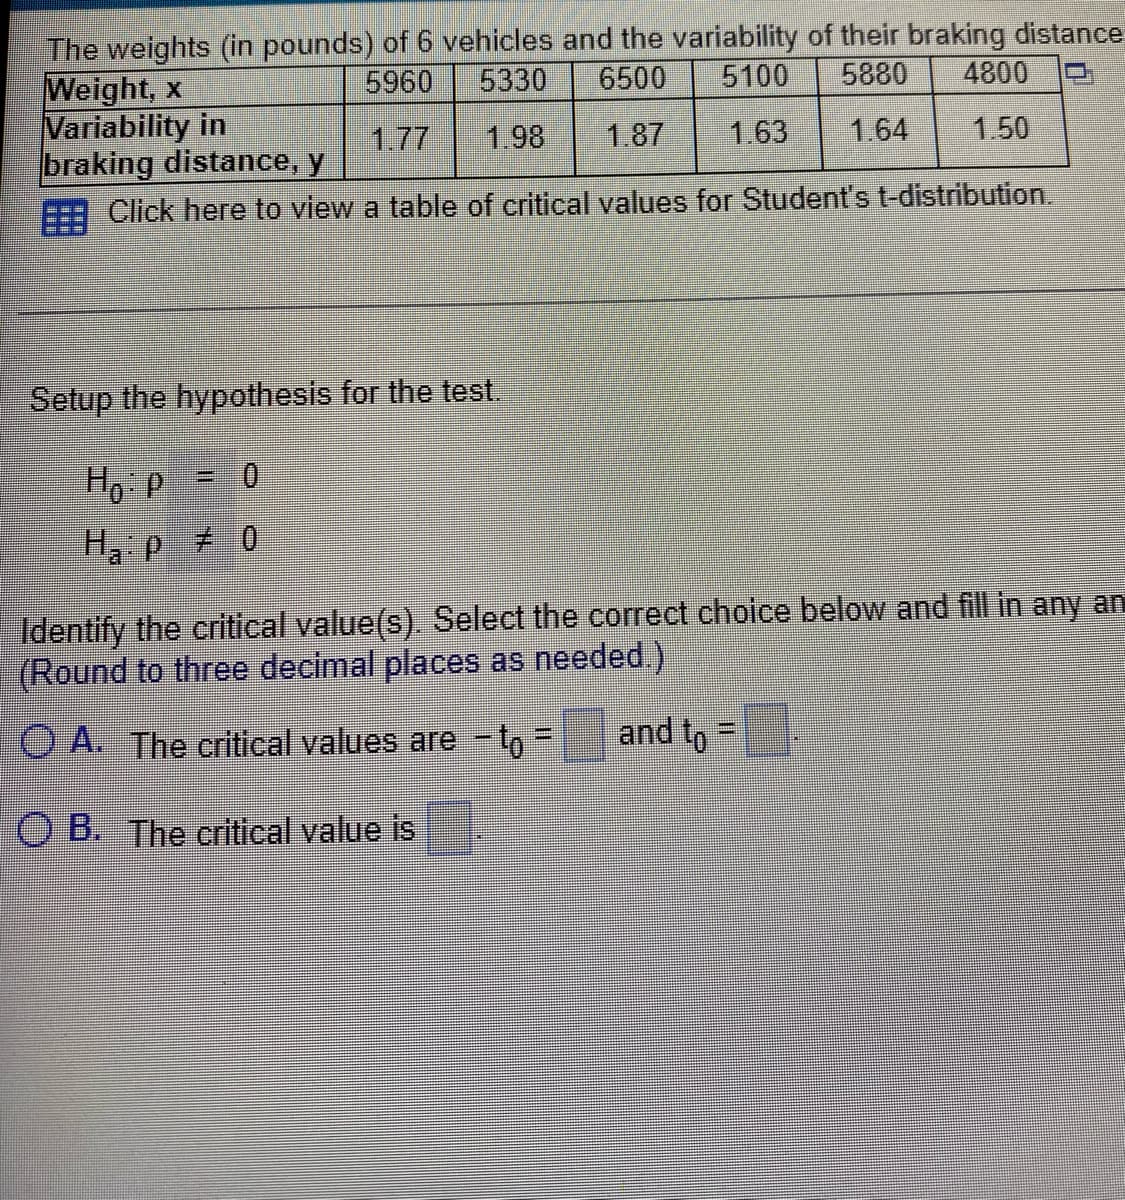
Transcribed Image Text:The weights (in pounds) of 6 vehicles and the variability of their braking distance
5960
5330
6500 5100 5880
4800
1.77 1.98
1.87 1.63
1.64
1.50
Weight, x
Variability in
braking distance, y
Click here to view a table of critical values for Student's t-distribution.
Setup the hypothesis for the test.
Ho P = 0
Ha: p ≠ 0
Identify the critical value(s). Select the correct choice below and fill in any an
(Round to three decimal places as needed.)
O A. The critical values are -to =
and to
OB. The critical value is
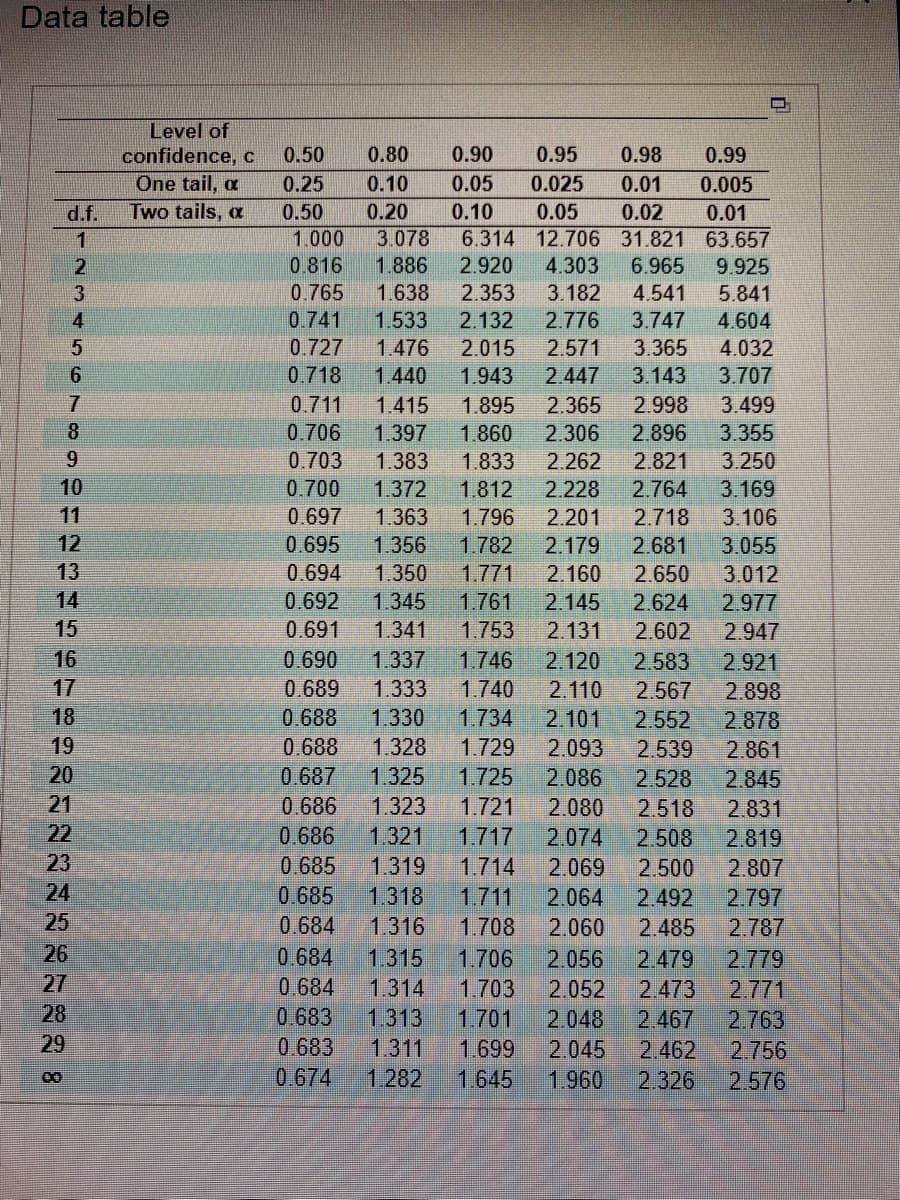
Transcribed Image Text:Data table
11
12
13
d.f.
1
2
3
4
5
6
7
8
9
CHELTERN8
15
16
17
18
19
20
21
22
23
24
25
26
27
28
29
00
Level of
confidence, c
One tail, a
Two tails, a
0.90 0.95 0.98
0.99
0.05
0.025
0.01
0.005
0.10
0.05
0.02
0.01
1.000
3.078
6.314 12.706 31.821 63.657
0.816 1.886 2.920 4.303
6.965
9.925
0.765
3.182
4.541
5.841
1.638 2.353
1.533 2.132 2.776 3.747 4.604
0.741
0.727 1.476 2.015
2.571
3.365
4.032
0.718
1.440
1.943 2.447
3.143 3.707
0.50
0.25
0.50
0.80
0.10
0.20
1.895 2.365
3.499
0.711 1.415
2.998
0.706 1.397 1.860 2.306 2.896 3.355
0.703 1.383 1.833 2.262 2.821 3.250
0.700 1.372 1.812 2.228 2.764 3.169
0.697 1.363 1.796 2.201 2.718 3.106
0.695 1.356 1.782 2.179 2.681 3.055
2.160 2.650
3.012
2.977
2.131
2.602
2.947
2.120 2.583 2.921
2.110 2.567
2.898
1.734 2.101 2.552
2.878
2.093
2.539
2.861
2.086 2.528
2.845
2.080 2.518
2.831
0.694 1.350 1.771
0.692 1.345 1.761 2.145 2.624
0.691 1.341 1.753
0.690 1.337 1.746
0.689 1.333 1.740
0.688 1.330
0.688 1.328 1.729
0.687 1.325 1.725
0.686 1.323 1.721
0.686 1.321
0.685
0.685 1.318
0.684
0.684 1.315 1.706 2.056 2.479
0.684 1.314 1.703
0.683 1.313 1.701
0.683 1.311
0.674 1.282
1.717 2.074
2.508
2.819
1.319 1.714
2.069 2.500
2.807
2.064 2.492
2.797
1.711
1.316 1.708 2.060
2.485
2.787
2.779
2.473
2.771
2.052
2.048 2.467 2.763
1.699 2.045 2.462 2.756
1.645 1.960 2.326 2.576
Expert Solution
This question has been solved!
Explore an expertly crafted, step-by-step solution for a thorough understanding of key concepts.

Step by step
Solved in 3 steps

Recommended textbooks for you
MATLAB: An Introduction with Applications
Statistics
ISBN:
9781119256830
Author:
Amos Gilat
Publisher:
John Wiley & Sons Inc

Probability and Statistics for Engineering and th…
Statistics
ISBN:
9781305251809
Author:
Jay L. Devore
Publisher:
Cengage Learning

Statistics for The Behavioral Sciences (MindTap C…
Statistics
ISBN:
9781305504912
Author:
Frederick J Gravetter, Larry B. Wallnau
Publisher:
Cengage Learning
MATLAB: An Introduction with Applications
Statistics
ISBN:
9781119256830
Author:
Amos Gilat
Publisher:
John Wiley & Sons Inc
Probability and Statistics for Engineering and th…
Statistics
ISBN:
9781305251809
Author:
Jay L. Devore
Publisher:
Cengage Learning
Statistics for The Behavioral Sciences (MindTap C…
Statistics
ISBN:
9781305504912
Author:
Frederick J Gravetter, Larry B. Wallnau
Publisher:
Cengage Learning

Elementary Statistics: Picturing the World (7th E…
Statistics
ISBN:
9780134683416
Author:
Ron Larson, Betsy Farber
Publisher:
PEARSON

The Basic Practice of Statistics
Statistics
ISBN:
9781319042578
Author:
David S. Moore, William I. Notz, Michael A. Fligner
Publisher:
W. H. Freeman

Introduction to the Practice of Statistics
Statistics
ISBN:
9781319013387
Author:
David S. Moore, George P. McCabe, Bruce A. Craig
Publisher:
W. H. Freeman