An economist is studying the job market in Denver area neighborhoods. Let x represent the total number of jobs in a given neighborhood, and let y represent the number of entry-level jobs in the same neighborhood. 13184 Denver neighborhoods gave the following information (units in hundreds of jobs). 17 30 52 28 50 25 3 5 9 3 A USE SALT Complete parts (a) through (e), given Ex = 202, Ey = 29, E - 7802, Ey? - 177, Exy - 1153, and r 0.9199. (a) Draw a scatter diagram displaying the data. jobs (in hundreds)
An economist is studying the job market in Denver area neighborhoods. Let x represent the total number of jobs in a given neighborhood, and let y represent the number of entry-level jobs in the same neighborhood. 13184 Denver neighborhoods gave the following information (units in hundreds of jobs). 17 30 52 28 50 25 3 5 9 3 A USE SALT Complete parts (a) through (e), given Ex = 202, Ey = 29, E - 7802, Ey? - 177, Exy - 1153, and r 0.9199. (a) Draw a scatter diagram displaying the data. jobs (in hundreds)

Algebra & Trigonometry with Analytic Geometry
13th Edition
ISBN:9781133382119
Author:Swokowski
Publisher:Swokowski
Chapter5: Inverse, Exponential, And Logarithmic Functions
Section5.6: Exponential And Logarithmic Equations
Problem 64E

Related questions
Question
Transcribed Image Text:ep%3D28174037&elSBN=9781337713184
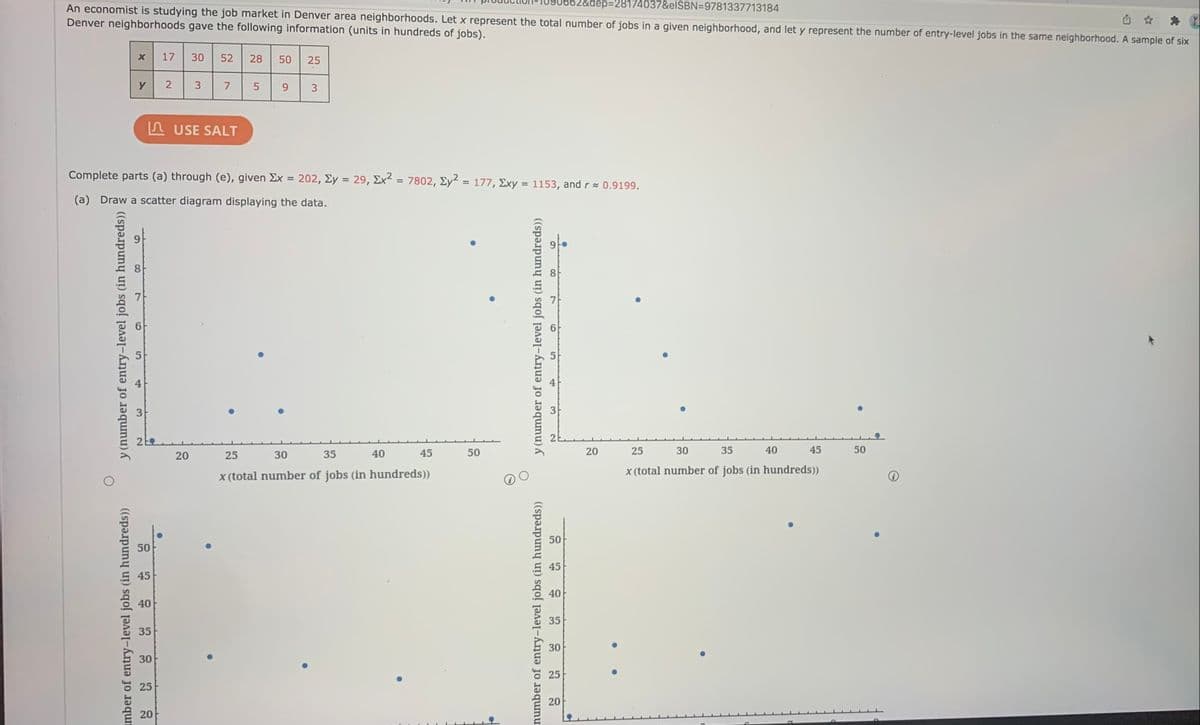
An economist is studying the job market in Denver area neighborhoods. Let x represent the total number of jobs in a given neighborhood, and let y represent the number of entry-level jobs in the same neighborhood. A sample of six
Denver neighborhoods gave the following information (units in hundreds of jobs).
17
30
52
28
50
25
9.
3
n USE SALT
Complete parts (a) through (e), given Ex = 202, Ey = 29, Ex = 7802, Ey = 177, Exy = 1153, and r 0.9199.
%3D
%3D
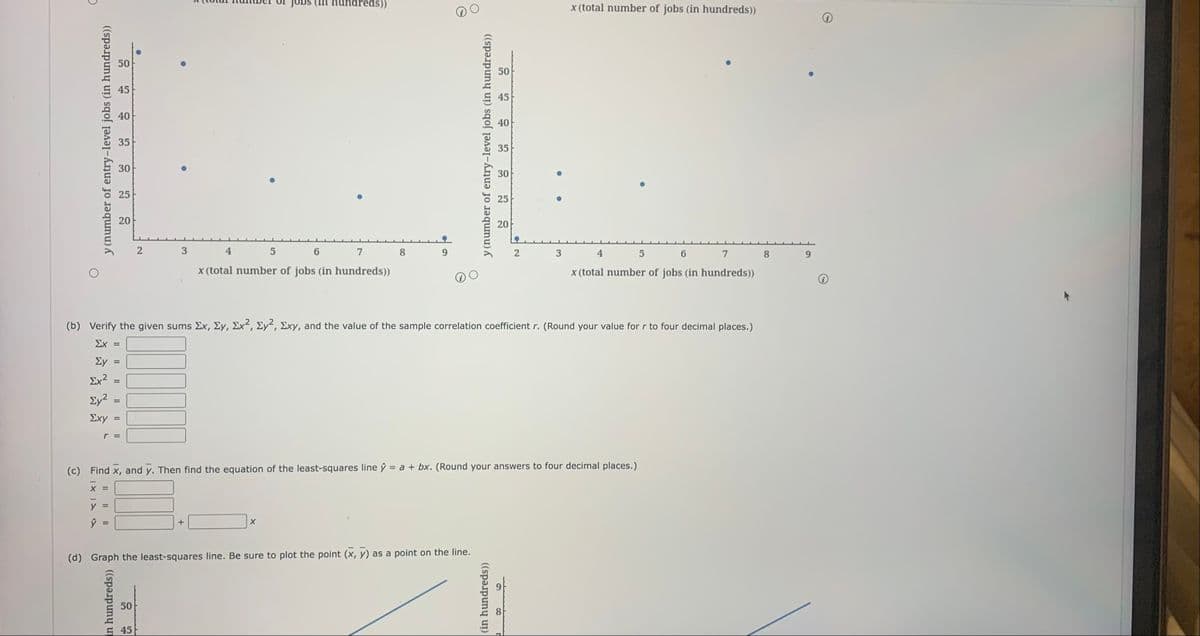
(a) Draw a scatter diagram displaying the data.
20
25
30
35
40
45
50
25
30
35
40
45
50
X (total number of jobs (in hundreds))
x (total number of jobs (in hundreds))
50
50
45
45
40
40
35
35
30
30
25
imber of entry-level jobs (in hundreds))
y (number of entry-level jobs (in hundreds))
20
25
number of entry-level jobs (in hundreds))
y (number of entry-level jobs (in hundreds))
20
20
Transcribed Image Text:în hundreds))
x (total number of jobs (in hundreds))
50
50
45
45
40
40
35
35
30
30
25
25
20
20
3
4
6.
7
8.
9.
2
4.
6.
7
8
9.
x (total number of jobs (in hundreds))
x (total number of jobs (in hundreds))
(b) Verify the given sums Ex, Ey, Ex, Ey, Exy, and the value of the sample correlation coefficient r. (Round your value for r to four decimal places.)
Σχ=
Ey
%3D
Σχ2
Ey?
%3D
Exy
%3D
r =
(c) Find x, and y. Then find the equation of the least-squares line ŷ = a + bx. (Round your answers to four decimal places.)
+
(d) Graph the least-squares line. Be sure to plot the point (x, y) as a point on the line.
50
8
45
in hundreds))
y (number of entry-level jobs (in hundreds))
(in hundreds))
y (number of entry-level jobs (in hundreds))
Expert Solution
This question has been solved!
Explore an expertly crafted, step-by-step solution for a thorough understanding of key concepts.

Step by step
Solved in 2 steps with 1 images

Recommended textbooks for you
Algebra & Trigonometry with Analytic Geometry
Algebra
ISBN:
9781133382119
Author:
Swokowski
Publisher:
Cengage
Algebra & Trigonometry with Analytic Geometry
Algebra
ISBN:
9781133382119
Author:
Swokowski
Publisher:
Cengage