A tire manufacturer is interested in testing the fuel economy for two different tread patterns. Tires of each tread type are driven for 1000 miles on each of 18 different cars. The mileages, in mpg, are presented in the following table. Car Tread A Tread B 24.1 20.3 22.3 19.7 24.5 22.5 26.1 23.2 22.6 20.4 23.3 23.5 22.4 21.9 8. 19.9 18.6 27.1 25.8 Car Tread A Tread B 10 23.5 21.4 11 25.4 20.6 12 24.9 23.4 13 23.7 20.3 14 23.9 22.5 15 24.6 23.5 16 26.4 24.5 17 21.5 22.4 18 24.6 24.9 Find a 99% confidence interval for the mean difference in fuel economy. A confidence interval based on the data in the table has width ±0.5 mpg. Is the level of this confidence interval closest to 80%, 90%, or 95%? a. Ь.
A tire manufacturer is interested in testing the fuel economy for two different tread patterns. Tires of each tread type are driven for 1000 miles on each of 18 different cars. The mileages, in mpg, are presented in the following table. Car Tread A Tread B 24.1 20.3 22.3 19.7 24.5 22.5 26.1 23.2 22.6 20.4 23.3 23.5 22.4 21.9 8. 19.9 18.6 27.1 25.8 Car Tread A Tread B 10 23.5 21.4 11 25.4 20.6 12 24.9 23.4 13 23.7 20.3 14 23.9 22.5 15 24.6 23.5 16 26.4 24.5 17 21.5 22.4 18 24.6 24.9 Find a 99% confidence interval for the mean difference in fuel economy. A confidence interval based on the data in the table has width ±0.5 mpg. Is the level of this confidence interval closest to 80%, 90%, or 95%? a. Ь.

Holt Mcdougal Larson Pre-algebra: Student Edition 2012
1st Edition
ISBN:9780547587776
Author:HOLT MCDOUGAL
Publisher:HOLT MCDOUGAL
Chapter11: Data Analysis And Probability
Section: Chapter Questions
Problem 8CR

Related questions
Question
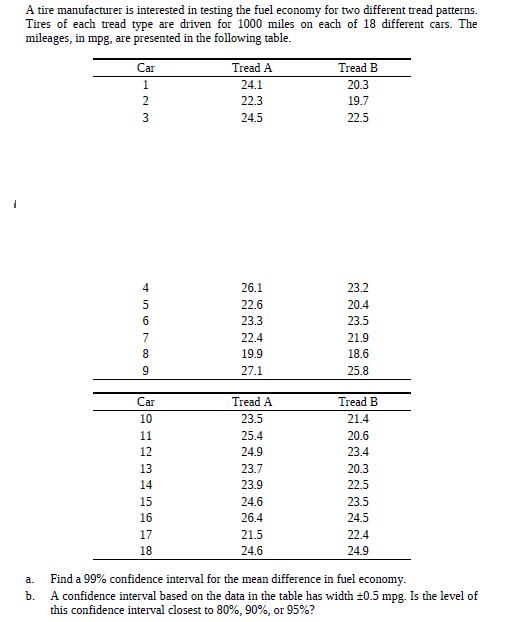
Transcribed Image Text:A tire manufacturer is interested in testing the fuel economy for two different tread patterns.
Tires of each tread type are driven for 1000 miles on each of 18 different cars. The
mileages, in mpg, are presented in the following table.
Car
Tread A
Tread B
24.1
20.3
22.3
19.7
24.5
22.5
26.1
23.2
22.6
20.4
23.3
23.5
22.4
21.9
8.
19.9
18.6
27.1
25.8
Car
Tread A
Tread B
10
23.5
21.4
11
25.4
20.6
12
24.9
23.4
13
23.7
20.3
14
23.9
22.5
15
24.6
23.5
16
26.4
24.5
17
21.5
22.4
18
24.6
24.9
Find a 99% confidence interval for the mean difference in fuel economy.
A confidence interval based on the data in the table has width ±0.5 mpg. Is the level of
this confidence interval closest to 80%, 90%, or 95%?
a.
Ь.
Expert Solution
This question has been solved!
Explore an expertly crafted, step-by-step solution for a thorough understanding of key concepts.

This is a popular solution!

Trending now
This is a popular solution!

Step by step
Solved in 3 steps with 3 images

Recommended textbooks for you
Holt Mcdougal Larson Pre-algebra: Student Edition…
Algebra
ISBN:
9780547587776
Author:
HOLT MCDOUGAL
Publisher:
HOLT MCDOUGAL

Glencoe Algebra 1, Student Edition, 9780079039897…
Algebra
ISBN:
9780079039897
Author:
Carter
Publisher:
McGraw Hill
Holt Mcdougal Larson Pre-algebra: Student Edition…
Algebra
ISBN:
9780547587776
Author:
HOLT MCDOUGAL
Publisher:
HOLT MCDOUGAL
Glencoe Algebra 1, Student Edition, 9780079039897…
Algebra
ISBN:
9780079039897
Author:
Carter
Publisher:
McGraw Hill