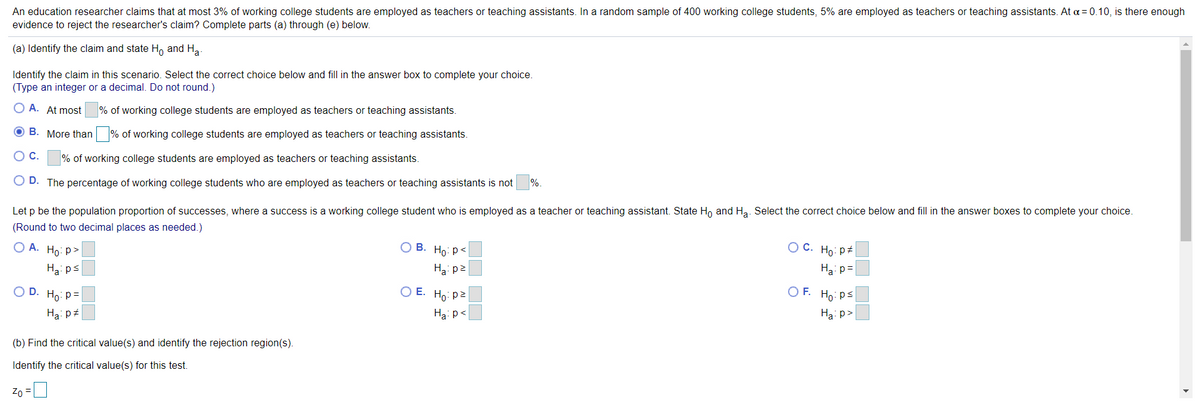
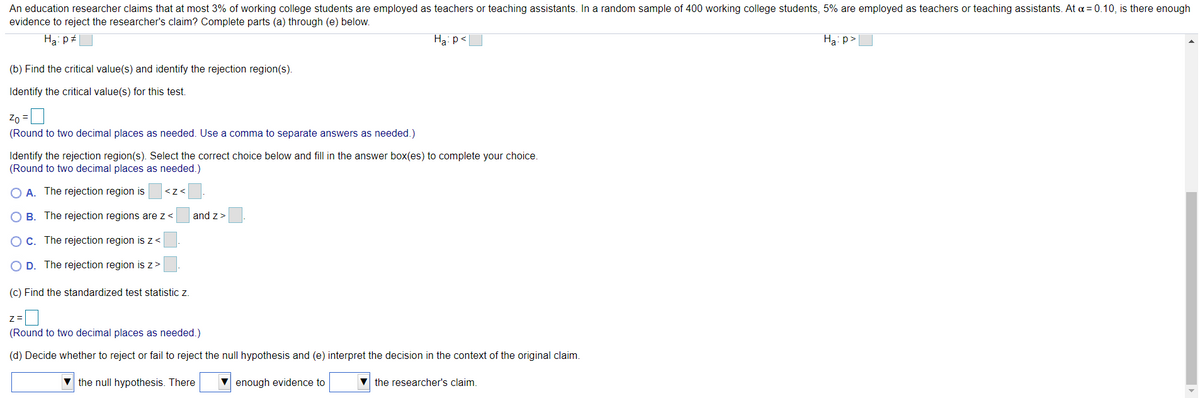
An education researcher claims that at most 3% of working college students are employed as teachers or teaching assistants. In a random sample of 400 working college students, 5% are employed as teachers or teaching assistants. At a=0.10, is there enou evidence to reject the researcher's claim? Complete parts (a) through (e) below. (a) Identify the claim and state H, and Ha Identify the claim in this scenario. Select the correct choice below and fill in the answer box to complete your choice. (Type an integer or a decimal. Do not round.) O A. At most % of working college students are employed as teachers or teaching assistants. O B. More than % of working college students are employed as teachers or teaching assistants. Oc. % of working college students are employed as teachers or teaching assistants. OD. The percentage of working college students who are employed as teachers or teaching assistants is not %. Let p be the population proportion of successes, where a success is a working college student who is employed as a teacher or teaching assistant. State Ho and Hg. Select the correct choice below and fill in the answer boxes to complete your choice. (Round to two decimal places as needed.) O A. Họ p> H ps OD. Ho p= O B. Ho: p< H p2 OE Ho p2 OC. Ho: p H p= OF. Ho ps Hai p> Ha p (b) Find the critical value(s) and identify the rejection region(s). Identify the critical value(s) for this test.


Inverse Normal Distribution
The method used for finding the corresponding z-critical value in a normal distribution using the known probability is said to be an inverse normal distribution. The inverse normal distribution is a continuous probability distribution with a family of two parameters.
Mean, Median, Mode
It is a descriptive summary of a data set. It can be defined by using some of the measures. The central tendencies do not provide information regarding individual data from the dataset. However, they give a summary of the data set. The central tendency or measure of central tendency is a central or typical value for a probability distribution.
Z-Scores
A z-score is a unit of measurement used in statistics to describe the position of a raw score in terms of its distance from the mean, measured with reference to standard deviation from the mean. Z-scores are useful in statistics because they allow comparison between two scores that belong to different normal distributions.


Trending now
This is a popular solution!

Step by step
Solved in 3 steps with 1 images


