an educator, would like to investigate whether students’ IQ have an effect on their exam scores. She also wants to determine if teaching strategy is associated with whether students pass or fail in the exam (exam result). She then randomly selected twenty students and conducted an IQ test. Further, she randomly assigned them to the two teaching strategies. The students’ exam scores were recorded. 1. At 5% level of significance, test whether the exam scores are indeed linearly dependent on IQ. Ho: (in symbols) _____ ; (in words) ____________________________________ Ha: (in symbols) _____ ; (in words) ____________________________________ Test Procedure: _______________________________ p-value: ___________ Decision: ________________________________ Conclusion: At alpha = 0.05,


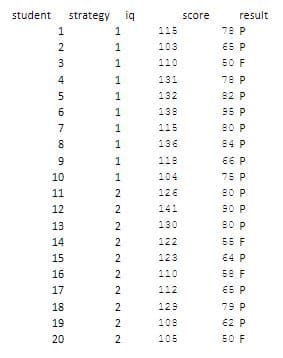
an educator, would like to investigate whether students’ IQ have an effect on their exam scores. She also wants to determine if teaching strategy is associated with whether students pass or fail in the exam (exam result). She then randomly selected twenty students and conducted an IQ test. Further, she randomly assigned them to the two teaching strategies. The students’ exam scores were recorded.
1. At 5% level of significance, test whether the exam scores are indeed linearly dependent on IQ.
Ho: (in symbols) _____ ; (in words) ____________________________________
Ha: (in symbols) _____ ; (in words) ____________________________________
Test Procedure: _______________________________
p-value: ___________
Decision: ________________________________
Conclusion: At alpha = 0.05,
________________________________________________________________ ________________________________________________________________
![Doornik-Hansen Test (Exam Scores vs IQ)
DH: 3.808173 p-value:
0.4325889
Correlation Coefficients between Exam Scores and IQ
Pearson's r
Spearman's
Kendall's t=
= 0.7403599
0.6021854
= 0.7680134
Ha: not equal to 0
Ha: not equal to 0
Ha: not equal to 0
p-value = 0.0001894
p-value = 0.0000768
Expected Frequencies of Strategy vs Exam Result
p-value = 0.0002619
strategy F P
128
228
RcmdrMsg: [22] WARNING:
RcmdrMsg- 2 expected frequencies are less than 5
Test of Independence between Strategy and Exam Result
Chi-Square p-
value = 0.2636
Fisher's Exact Test
p-value = 0.582
Regression of Exam Scores on IQ
Coefficients:
(Intercept) -23.9831
0.7955
Estimate Std. Error t value Pr(>|t|)
28.5950 -1.165 0.259419
4.673 0.000189 ***
0.1703
signif. codes:
0.001 *** 0.01
0.05
Residual standard error: 8.92 on 18 degrees of freedom
Multiple R-squared: 0.5481,
F-statistic: 21.83 on 1 and 18 DF, p-value: 0.0001894
Adjusted R-squared: e.523](/v2/_next/image?url=https%3A%2F%2Fcontent.bartleby.com%2Fqna-images%2Fquestion%2F2f56f0ba-0f12-4b77-9e95-d1b6584f528f%2F0b10af56-76a2-43d7-9092-26b533a6a10f%2Ff0m8mtd_processed.jpeg&w=3840&q=75)

Step by step
Solved in 3 steps


