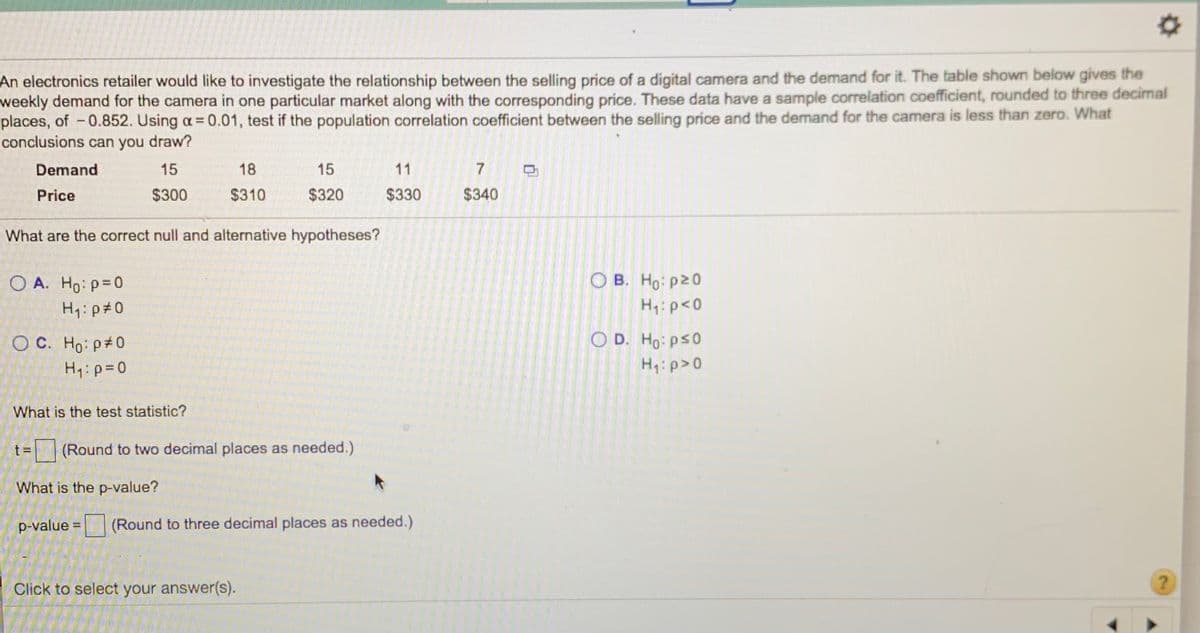
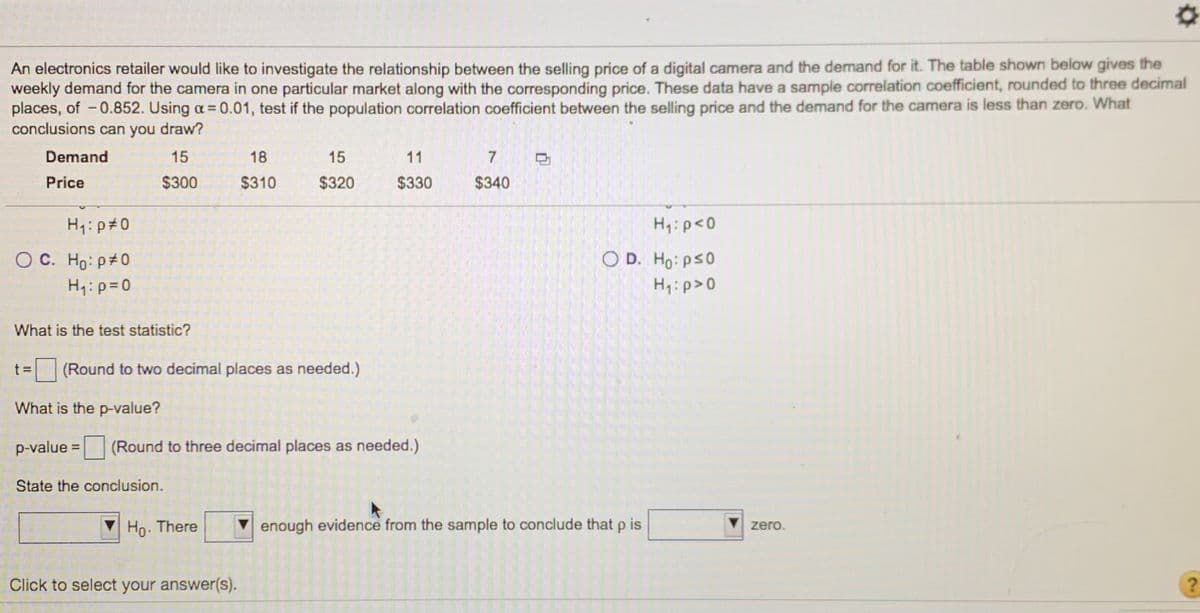
An electronics retailer would like to investigate the relationship between the selling price of a digital camera and the demand for it. The table shown below gives the weekly demand for the camera in one particular market along with the corresponding price. These data have a sample correlation coefficient, rounded to three decimal places, of -0.852. Using a =0.01, test if the population correlation coefficient between the selling price and the demand for the camera is less than zero. What conclusions can you draw? Demand 15 18 15 11 7 Price $300 $310 $320 $330 $340


Correlation
Correlation defines a relationship between two independent variables. It tells the degree to which variables move in relation to each other. When two sets of data are related to each other, there is a correlation between them.
Linear Correlation
A correlation is used to determine the relationships between numerical and categorical variables. In other words, it is an indicator of how things are connected to one another. The correlation analysis is the study of how variables are related.
Regression Analysis
Regression analysis is a statistical method in which it estimates the relationship between a dependent variable and one or more independent variable. In simple terms dependent variable is called as outcome variable and independent variable is called as predictors. Regression analysis is one of the methods to find the trends in data. The independent variable used in Regression analysis is named Predictor variable. It offers data of an associated dependent variable regarding a particular outcome.
An electronic retailer would like to investigate the relationship between the selling price of a digital camera and the demand for it. The table shown below gives the weekly demand for the camera in one particular market along with the corresponding price. These data have a sample
I am having trouble with this question. Please help!


Trending now
This is a popular solution!

Step by step
Solved in 3 steps with 1 images


