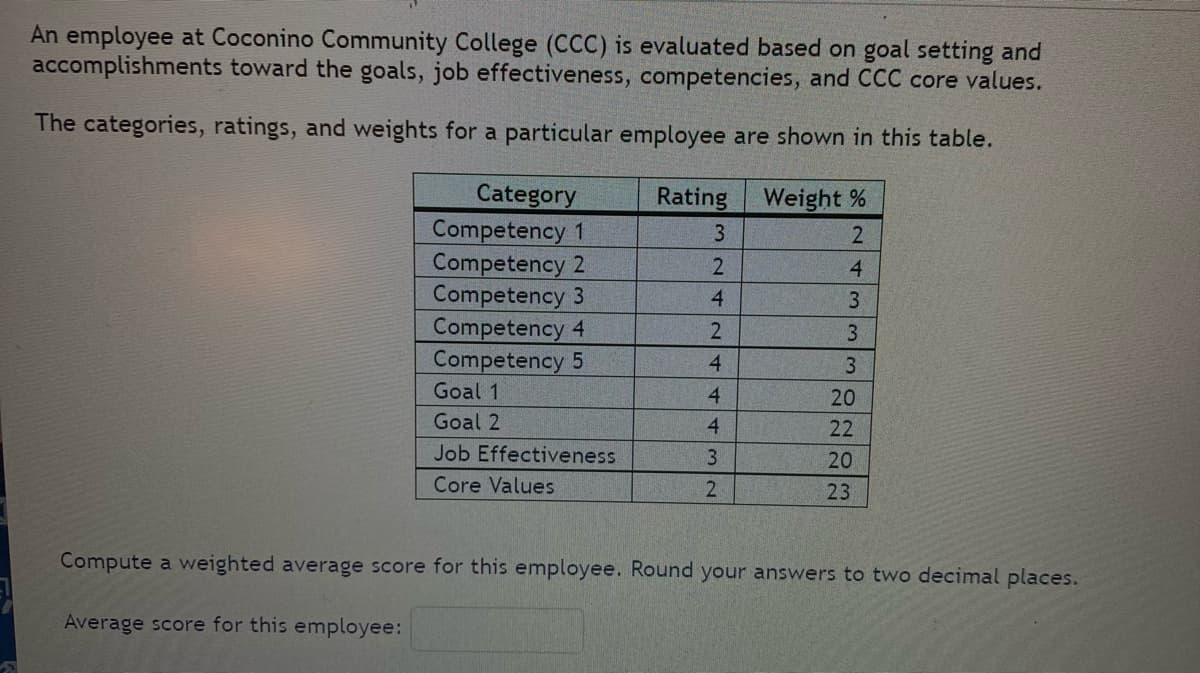
An employee at Coconino Community College (CCC) is evaluated based on goal setting and accomplishments toward the goals, job effectiveness, competencies, and CCC core values. The categories, ratings, and weights for a particular employee are shown in this table. Rating Weight % 3 2 4 3 3 3 Category Competency 1 Competency 2 Competency 3 Competency 4 Competency 5 Goal 1 Goal 2 Job Effectiveness. Core Values JANW 2 4 2 4 4 4 3 2 20 22 20 23 Compute a weighted average score for this employee. Round your answers to two decimal places. Average score for this employee:
Q: From a large number of actuarial exam scores, a random sample of 200 scores is selected, and it is…
A: Given,n=200x=148p^=xnp^=148200=0.7401-p^=1-0.740=0.260α=1-0.90=0.1α2=0.05Z0.05=1.645
Q: Life on Other Planets Forty-five percent of people believe that there is life on other planets in…
A:
Q: Question 24 Reminder: If you have a Poisson Distribution with Parameter then its Probability Density…
A: When Let X be the Poisson distribution
Q: 5.17 If X represents the number of people in Exer- cise 5.13 who believe that antidepressants do not…
A: 5.17Givenp=0.70sample size(n)=5Let "x" be no.of people who beleive that antipressants do not cure…
Q: Two cards are drawn without replacement from a well-shuffled standard 52-card deck of playing…
A: From the provided information, Total cards in standard deck = 52 Number of face cards = 12 Total Ace…
Q: Water Consumption The Old Farmer's Almanac stated that the average consumption of water per person…
A: Introduction: Denote μ as the current true average consumption of water per person per day.
Q: The accompanying table shows the number of text messages sent and received by some people in one…
A: Please find the explanation below. Thank you.
Q: For this experiment Consider a Grade School Class that has 23 males and 31 females. And we are going…
A: GivenNo.of male students = 23No.of female students = 31Total no.of students = 54
Q: Which of the following are categorical (or qualitative) variables in these records? Student Age…
A: Categorical data: The data that consists of the attributes that has different categories, names or…
Q: Exhibit 13-21 Source of Variation Between Groups (Treatment) 6,000.0 Within Groups (Error) Total Sum…
A: Solution-: Source of variation SS df Mean Square F Between Groups (Treatment) 6000 5 1200 4.17…
Q: Scores on a statistics final in a large class were normally distributed with a mean of 75 and a…
A: given data normal distributionμ = 75σ = 7.5
Q: A test has two portions: verbal and math. The scores for each portion are positively correlated with…
A: From the given information, A test has two portions: verbal and math Correlation between verbal and…
Q: A random sample of 49 cans of soda is obtained and the contents are measured. The sample mean is…
A: From given data we have : mean x=12.01 the standard deviation s=0.13 n=49
Q: Kelly plans to go on a vacation to Las Vegas during Christmas, but the availability of rooms in the…
A: Kelly plans to go on a vacation to Las Vegas during Christmas, but the availability of rooms in the…
Q: Copy Data Step 2 of 4: Calculate the expected value for the number of silver cars with 2-3 moving…
A: It is given that Total cars = 719 Total Silver cars = 63 Total 2-3 moving violations = 238
Q: In a random sample of 1000 B.Com students, 125 said that they wanted to become Statisticians. Assume…
A:
Q: Working in the garden pulling weeds/planting flowers burns an average of 200 calories per hour. If…
A: given data μ=200σ=9normal distribution P(200<x<225)=?
Q: Exhibit 10-19 Two major automobile manufacturers have produced compact cars with the same size…
A: Hypothesis : A statement about the parameters of the probability distribution. t-Test is used when…
Q: Determine the number for which the sum for both dice is 10. Determine the number for which the sum…
A: Given that there is two dice and we know that there will be total 36 outcome so we have find number…
Q: Step 1 of 4: Calculate the expected value for the number of doctors voting for the Democratic party.…
A: It is given that Total doctors = 75 Total democrats = 177 Total voters = 323
Q: Assume that 13% of people are left-handed. We select 4 people at random. a) How many lefties do you…
A: given data P(left handed) = p = 0.13 select n = 4 peoples x = no of left handed people
Q: Working in the garden pulling weeds/planting flowers burns an average of 200 calories per hour. If…
A: It is given that Mean, μ = 200 Standard deviation, σ = 9 Z-Score, Z = ( X - μ )/σ
Q: 5. Using the data age and wage, predict the wage when age ranges over a grid of points of size 100…
A: The data wage and age are present in defualt in R-studio. The data is created in R in the following…
Q: You roll a die with the sample space S= (1, 2, 3, 4, 5, 6). You define A as (1, 2, 3), B as (1, 2,…
A:
Q: How is validity realized in qualitative research?
A: In qualitative research : There are two types of validity criteria : 1 : Primary validity criteria…
Q: Tesco Revenue by Location between 2018 and 2022 Year Number of stores Uk & ROI Revenue (£m)…
A: Year Number of stores UK & ROI Revenue (£m) Central Europe Revenue (£m) Tesco Bank Revenue (£m)…
Q: A sample of 9 sales prices of homes within the Lima area was collected and displayed in the table…
A: The data shows the 9 sales prices of homes within the Lima area.
Q: The physical plant at the main campus of a large state university recieves daily requests to replace…
A: given data normal distribution μ = 59σ = 4 P(59<x<71) = ?
Q: Question 8 Assume the mean useful life of a Caterpillar motor is 500,000 hours and is normally…
A: Given: Mean μ = 500,000 Standard deviation σ = 50,000 X = 605,000 Formula Used: Z-score = X-μσ
Q: Question 3 P is a Probability Density Function on a space S Let A be a set of events of S Then P(A)…
A: Sure or certain event has probability of 1.
Q: For this experiment Consider a Grade School Class that has 23 males and 31 females. And we are going…
A:
Q: Find the grade point average. Assume that the grade point values are 4.0 for an A, 3.0 for a B, and…
A: Given Grade point value for A=4, Grade point value for B=3 Grade point value for C=2
Q: Imagine you are doing a Related-Samples t-test, and you are on Step Three of the hypothesis test.…
A: Data given sample of difference scores that you calculated is -2, -4, -3, +1
Q: Here are summary statistics for randomly selected weights of newborn girls: n=186, x=31.6 hg,…
A:
Q: You’re a human factors engineer studying the impact that helmets worn by operators on a factory…
A: Given that Sample size n =50 Favorable cases x =18 Sample proportion p^=x/n =18/50 =0.36
Q: Medical School Applications A medical college dean read that the average number of applications a…
A: Given that Sample size n =29 Sample mean=8.7 Population standard deviation =2.6
Q: The amounts of nicotine in a certain brand of cigarette are normally distributed with a mean of…
A: given datanormal distribution μ=0941σ=0.294P(x<0.588)=?
Q: Sum of Squares Between Groups (Treatment) 6,000.0 Within Groups (Error) Total Source of Variation…
A: Hint: The source of variation given in the problem above tells the best test statistic to test the…
Q: In order to determine whether or not there is a significant difference between the hourly wages of…
A: From the provided information, n1=50x1=20.50σ1=2.5n2=70x2=10.25σ2=2.00
Q: The following table provides hypothetical information on 10 TTSE companies. The table gives the…
A:
Q: Exhibit 13-21 Source of Variation Between Groups (Treatment) 6,000.0 Within Groups (Error) Total OSI…
A:
Q: Find the p-value using Excel (not Appendix D): (Round your answers to 4 decimal places.) (a)…
A: Given All p value calculated from Excel
Q: A store's sales (in thousands of dollars) grows according to the linear model y=25+10x, where x…
A: The question is about linear model Given : The eq. of linear model : y = 25 + 10 x Where, y :…
Q: Data was collected for a sample of organic snacks. The amount of sugar (in mg) in each snack is…
A: from given histogram we have to find sample size.
Q: What is the expected number of 6's rolled?
A: Given: Let x be the number of six's rolled can be modelled with probability p=1/6 No of roll n=…
Q: Plot the density curve.
A: Given X~U(4,6)
Q: Determine the area under the standard normal curve that lies between (a) Z= -0.33 and Z= 0.33, (b)…
A: Answer:- Given, standard normal curve with Find the area under the standard normal curve (a)…
Q: A random sample of 36 cans of soda is obtained and the contents are measured. The sample mean is…
A: Given Population mean μ=12, n=36, sample mean x̄=12.05, s=0.11
Q: For this experiment Consider a Grade School Class that has 23 males and 31 females. And we are going…
A: According to given question, We have:- Parameters of binomial distribution are n and p where and…
Q: If you were going to evaluate the how much money you would need to save each month if you wanted to…
A: Some of the basic notations used in excel financial functions are given below: rate Interest rate…
Step by step
Solved in 3 steps
- Janice Gould of Krebs Consulting is in the process of making a recommendation to a client regarding the corporate-wide purchase of an analytical software platform. She has made the following estimates on management’s most important performance criteria and has rated three Software packages across these criteria. Rating PerformanceCriterion FactorWeight SoftwareA SoftwareB SoftwareC Functionality 25 9 8 9 Vendor reliability 10 7 5 9 Compatibility withcurrentsystems 20 6 8 6 Maintenance & support 10 5 5 8 Total cost 25 4 8 5 Speed ofimplementation 10 8 4 7 a. Which software platform would you recommend?b. Assume that the client changes their mind and now argues that the maintenance and support criterion is already accounted for by the total cost criterion. Further, the client asks Ms. Gould to drop maintenance and support and add its factor weight to total cost. Will this client request alter the recommendation?The Tire Rack, America’s leading online distributor of tires and wheels, conducts extensive testing to provide customers with products that are right for their vehicle, driving style, and driving conditions. In addition, the Tire Rack maintains and independent consumer survey to help drivers help each other by sharing their long-term driving experiences. The following data show survey ratings (1 to 10 scale with 10 the highest rating) for 18 maximum performance summer tires. The variable Steering rates the tire’s steering responsiveness, Tread Wear rates quickness of wear based on the driver’s expectations, and Buy Again rates the driver’s overall tire satisfaction and desire to purchase the same tire again. Develop the estimated regression equation that can be used to predict the Buy Again rating given based on the Steering rating. At the .05 level of significance, test for a significant relationship. Did the estimated regression equation developed in part (a) provide a good fit to…Analyzing the data points circled, performance variation is likely attributed to the violation of which control chart criteria? A) 8 points in a row below Center Line (CL) B) 4 or 5 points between +1 σ and +2 σ C) 4 or 5 points between -1 σ and -2 σ D) One point below Lower Control Limit (LCL)
- Three training methods were compared to see whether they led to greater productivity after training. The following are productivity measures for individuals trained by each method. METHOD I METHOD II METHOD III 45 59 41 40 43 37 50 47 43 59 51 40 53 39 52 44 49 37 At the 0.05 level of significance, do the three training methods lead to different levels of productivity?Brunt, Rhee, and Zhong (2008) surveyed 557 undergraduate college students to examine their weight status, health behaviors, and diet. Using body mass index (BMI), they classified the students into four categories: underweight, health weight, overweight, and obese. They also measured dietary variety by counting the number of different foods each student ate from several food groups. Note that the researchers are not measuring the amount of food eaten, but rather the number of different foods eaten (variety, not quantity). Nonetheless, it was somewhat surprising that the four weight groups all ate essentially the same number of fatty and/or sugary snacks. Suppose a researcher conducting a follow up study obtains a sample of n=25 students classified as health weight and a sample of n=36 students classified as overweight. Each student completes the food variety questionnaire, and the healthy-weight group produces a mean of M=4.01 for the fatty, sugary snack category compared to a mean of…A performance evaluation for new sales representatives at Office Automation Incorporated involves several ratings done on a scale of 1 to 10, with 10 the highest rating. The activities rated include new contacts, successful contacts, total contacts, dollar volume of sales, and reports. Then an overall rating is determined by using a weighted average. The weights are 3 for new contacts, 1 for successful contacts, 4 for total contacts, 3 for dollar value of sales, and 5 for reports. What would the overall rating be for a sales representative with ratings of S for new contacts, 7 for successful contacts, 6 for total contacts, 2 for dollar volume of sales, and 4 for report:? (Round your answer to two decimal
- 3. PC Magazine provided ratings for several characteristics of computer monitors, including an overall rating (PC Magazine website, April, 2015). The following data show the rating for contrast ratio, resolution, and the overall rating for ten monitors tested using a 0–100 point scale. The highest rated monitor was the BenQ BL3201PH, with an overall rating of 87. solutions only on excel Model Contrast Ratio Resolution Overall Rating BenQ BL3201PH 78 89 87 AOC U2868PQU 98 87 86 NEC MultiSync PA322UHD 84 82 85 Acer XB280HK 78 77 82 Asus ROG Swift PG278Q 65 82 82 AOC E1759Fwu 57 78 82 Dell UltraSharp UZ2715H 56 83 81 NEC MultiSync EA244UHD 77 75 79 HP DreamColor Z27x 47 81 77 Dell UltraSharp UZ2315H 55 70 76 a. Develop the estimated regression equation that can be used to predict the Overall Rating using the Contrast Ratio Rating. b. Develop the estimated regression…Brunt, Rhee, and Zhong (2008) surveyed 557 undergraduate college students to examine their weight status, health behaviors, and diet. Using body mass index (BMI), they classified the students into four categories: underweight, healthy weight, overweight, and obese. They also measured dietary variety by counting the number of different foods each student ate from several food groups. Note that the researchers are not measuring the amount of food eaten, but rather the number of different foods eaten (variety, not quantity). Nonetheless, it was somewhat surprising that the results showed no differences among the four weight categories that were related to eating fatty and/or sugary snacks.Suppose a researcher conducting a follow up study obtains a sample of n = 25 students classified as healthy weight and a sample of n = 36 students classified as overweight. Each student completes the food variety questionnaire, and the healthy-weight group produces a mean of µ = 4.01 for the fatty,…