An engineer working for a large agribusiness has developed two types of soil additives he calls Add1 and Add2. The engineer wants to test whether there is any difference between the two additives in the mean yield of tomato plants grown using these additives. The engineer studies a random sample of 12 tomato plants grown using Add1 and random sample of 13 tomato plants grown using Add2. (These samples are chosen independently.) When the plants are harvested, he counts their yields. These data are shown in the table. Yields (in number of tomatoes) Add1 162, 168, 175, 167, 181, 180, 187, 171, 167, 191, 166, 172 Add2 178, 185, 185, 227, 145, 202, 218, 211, 156, 164, 173, 194, 166 Send data to calculator Send data to Excel Assume that the two populations of yields are approximately normally distributed. Can the engineer conclude, at the 0.10 level of significance, that there is a difference between the population mean of the yields of tomato plants grown with Addi and the population mean of the yields of tomato plants grown with Add2? Perform a two-tailed test. Then complete the parts below. Carry your intermediate computations to three or more decimal places. (If necessary, consult a list of formulas.)
An engineer working for a large agribusiness has developed two types of soil additives he calls Add1 and Add2. The engineer wants to test whether there is any difference between the two additives in the mean yield of tomato plants grown using these additives. The engineer studies a random sample of 12 tomato plants grown using Add1 and random sample of 13 tomato plants grown using Add2. (These samples are chosen independently.) When the plants are harvested, he counts their yields. These data are shown in the table. Yields (in number of tomatoes) Add1 162, 168, 175, 167, 181, 180, 187, 171, 167, 191, 166, 172 Add2 178, 185, 185, 227, 145, 202, 218, 211, 156, 164, 173, 194, 166 Send data to calculator Send data to Excel Assume that the two populations of yields are approximately normally distributed. Can the engineer conclude, at the 0.10 level of significance, that there is a difference between the population mean of the yields of tomato plants grown with Addi and the population mean of the yields of tomato plants grown with Add2? Perform a two-tailed test. Then complete the parts below. Carry your intermediate computations to three or more decimal places. (If necessary, consult a list of formulas.)

Holt Mcdougal Larson Pre-algebra: Student Edition 2012
1st Edition
ISBN:9780547587776
Author:HOLT MCDOUGAL
Publisher:HOLT MCDOUGAL
Chapter11: Data Analysis And Probability
Section: Chapter Questions
Problem 8CR

Related questions
Question
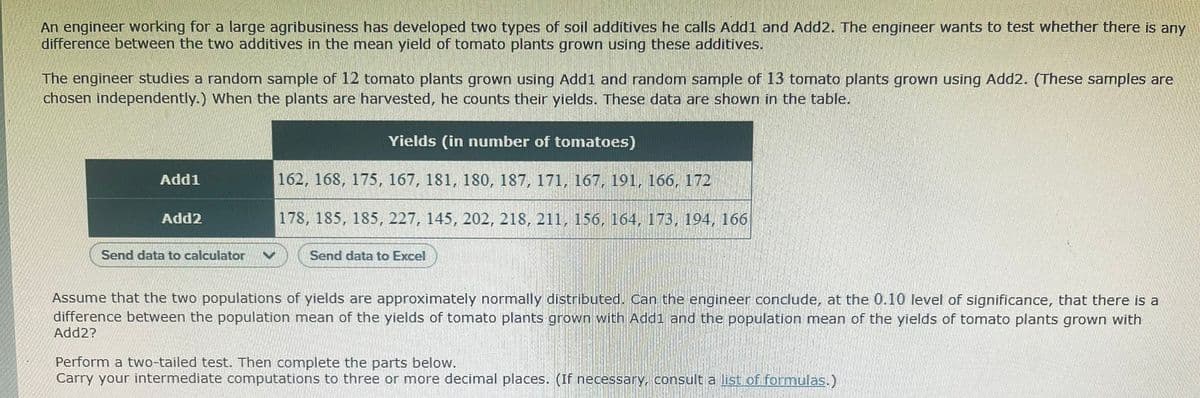
Transcribed Image Text:An engineer working for a large agribusiness has developed two types of soil additives he calls Add1 and Add2. The engineer wants to test whether there is any
difference between the two additives in the mean yield of tomato plants grown using these additives.
The engineer studies a random sample of 12 tomato plants grown using Add1 and random sample of 13 tomato plants grown using Add2. (These samples are
chosen independently.) When the plants are harvested, he counts their yields. These data are shown in the table.
Yields (in number of tomatoes)
Add1
162, 168, 175, 167, 181, 180, 187, 171, 167, 191, 166, 172
Add2
178, 185, 185, 227, 145, 202, 218, 211, 156, 164, 173, 194, 166
Send data to calculator
Send data to Excel
Assume that the two populations of yields are approximately normally distributed. Can the engineer conclude, at the 0.10 level of significance, that there is a
difference between the population mean of the yields of tomato plants grown with Addi and the population mean of the yields of tomato plants grown with
Add2?
Perform a two-tailed test. Then complete the parts below.
Carry your intermediate computations to three or more decimal places. (If necessary, consult a list of formulas.)
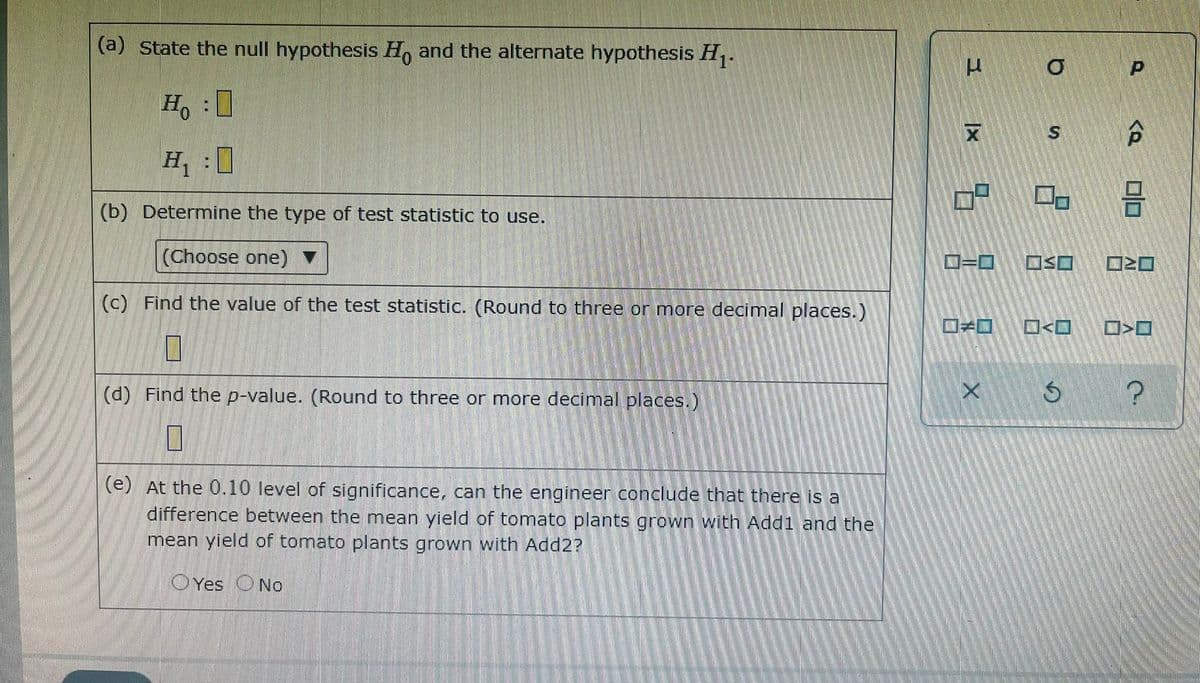
Transcribed Image Text:(a) State the null hypothesis H, and the alternate hypothesis H.
Ho
S
H :0
(b) Determine the type of test statistic to use.
(Choose one)
D=D
OSO
(c) Find the value of the test statistic. (Round to three or more decimal places.)
(d) Find the p-value. (Round to three or more decimal places.)
(e) At the 0.10 level of significance, can the engineer conclude that there is a
difference between the mean yield of tomato plants grown with Add1 and the
mean yield of tomato plants grown with Add2?
OYes ONo
Expert Solution
This question has been solved!
Explore an expertly crafted, step-by-step solution for a thorough understanding of key concepts.

This is a popular solution!

Trending now
This is a popular solution!

Step by step
Solved in 4 steps with 2 images

Recommended textbooks for you
Holt Mcdougal Larson Pre-algebra: Student Edition…
Algebra
ISBN:
9780547587776
Author:
HOLT MCDOUGAL
Publisher:
HOLT MCDOUGAL

Algebra & Trigonometry with Analytic Geometry
Algebra
ISBN:
9781133382119
Author:
Swokowski
Publisher:
Cengage
Holt Mcdougal Larson Pre-algebra: Student Edition…
Algebra
ISBN:
9780547587776
Author:
HOLT MCDOUGAL
Publisher:
HOLT MCDOUGAL
Algebra & Trigonometry with Analytic Geometry
Algebra
ISBN:
9781133382119
Author:
Swokowski
Publisher:
Cengage