An experiment involves dropping a ball and recording the distance it falls (y) for different times (x) after it was released. Construct a scatterplot and identify the mathematical model that best fits the given data. Assume that the model is to be used only for the scope of the given data, and consider only linear, quadratic, logarithmic, exponential, and power models. Q Time (seconds) 0.5 Distance (meters) 1.2 1 1.5 2 2.5 28.3 4.8 10.7 18.6 Choose the correct scatterplot below. O A. Ay 50- 40- 30- 20- 10- 0- 0 O O 0 X Q Q O B. Ay 50- 40- 30 o 20- 10- 0 0 O O 3 39.5 Q Q (...) O C. Ay 50- 40- 30- 20- 10- 0 O X Q Q O D. A 50- 40- o 30- 20- 10- 0- 0 1 O O 2 X Q
An experiment involves dropping a ball and recording the distance it falls (y) for different times (x) after it was released. Construct a scatterplot and identify the mathematical model that best fits the given data. Assume that the model is to be used only for the scope of the given data, and consider only linear, quadratic, logarithmic, exponential, and power models. Q Time (seconds) 0.5 Distance (meters) 1.2 1 1.5 2 2.5 28.3 4.8 10.7 18.6 Choose the correct scatterplot below. O A. Ay 50- 40- 30- 20- 10- 0- 0 O O 0 X Q Q O B. Ay 50- 40- 30 o 20- 10- 0 0 O O 3 39.5 Q Q (...) O C. Ay 50- 40- 30- 20- 10- 0 O X Q Q O D. A 50- 40- o 30- 20- 10- 0- 0 1 O O 2 X Q

Chapter6: Exponential And Logarithmic Functions
Section: Chapter Questions
Problem 33PT: Enter the data from Table 2 into a graphing calculator and graph the ranking scatter plot. Determine...

Related questions
Question
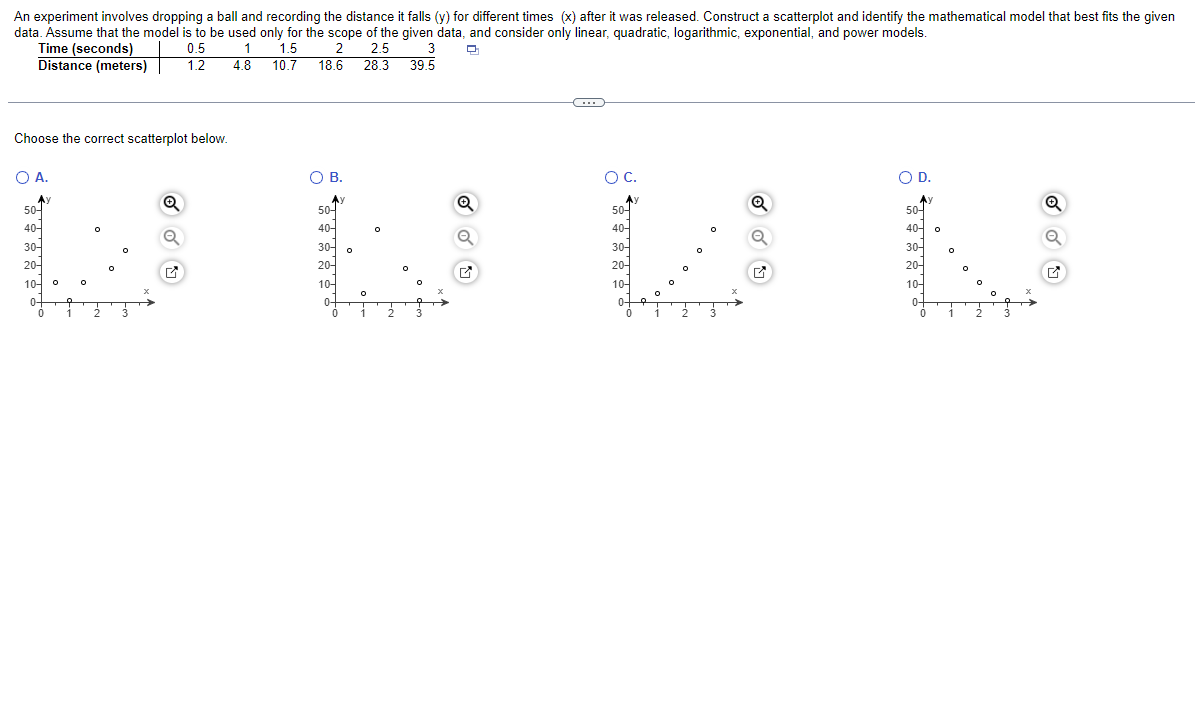
Transcribed Image Text:An experiment involves dropping a ball and recording the distance it falls (y) for different times (x) after it was released. Construct a scatterplot and identify the mathematical model that best fits the given
data. Assume that the model is to be used only for the scope of the given data, and consider only linear, quadratic, logarithmic, exponential, and power models.
Q
Time (seconds)
0.5
Distance (meters) 1.2
1
1.5
2
2.5
28.3
4.8
10.7
18.6
Choose the correct scatterplot below.
O A.
Ay
50-
40-
30-
20-
10-
0-
0
O
O
0
X
Q
Q
O B.
Ay
50-
40-
30 o
20-
10-
0
0
O
O
3
39.5
Q
Q
(...)
O C.
Ay
50-
40-
30-
20-
10-
0
O
X
Q
Q
O D.
A
50-
40- o
30-
20-
10-
0-
0
1
O
O
2
X
Q
Expert Solution
This question has been solved!
Explore an expertly crafted, step-by-step solution for a thorough understanding of key concepts.

Step by step
Solved in 2 steps with 2 images

Recommended textbooks for you

College Algebra (MindTap Course List)
Algebra
ISBN:
9781305652231
Author:
R. David Gustafson, Jeff Hughes
Publisher:
Cengage Learning

Algebra & Trigonometry with Analytic Geometry
Algebra
ISBN:
9781133382119
Author:
Swokowski
Publisher:
Cengage
College Algebra (MindTap Course List)
Algebra
ISBN:
9781305652231
Author:
R. David Gustafson, Jeff Hughes
Publisher:
Cengage Learning
Algebra & Trigonometry with Analytic Geometry
Algebra
ISBN:
9781133382119
Author:
Swokowski
Publisher:
Cengage

College Algebra
Algebra
ISBN:
9781305115545
Author:
James Stewart, Lothar Redlin, Saleem Watson
Publisher:
Cengage Learning

Algebra and Trigonometry (MindTap Course List)
Algebra
ISBN:
9781305071742
Author:
James Stewart, Lothar Redlin, Saleem Watson
Publisher:
Cengage Learning