an experiment was conducted in order to letermine if cerebral blood flow in human eings can be predicted from arterial oxygen ension (millimeters of mercury). Fifteen atients participated in the study, and the
an experiment was conducted in order to letermine if cerebral blood flow in human eings can be predicted from arterial oxygen ension (millimeters of mercury). Fifteen atients participated in the study, and the

MATLAB: An Introduction with Applications
6th Edition
ISBN:9781119256830
Author:Amos Gilat
Publisher:Amos Gilat
Chapter1: Starting With Matlab
Section: Chapter Questions
Problem 1P

Related questions
Question
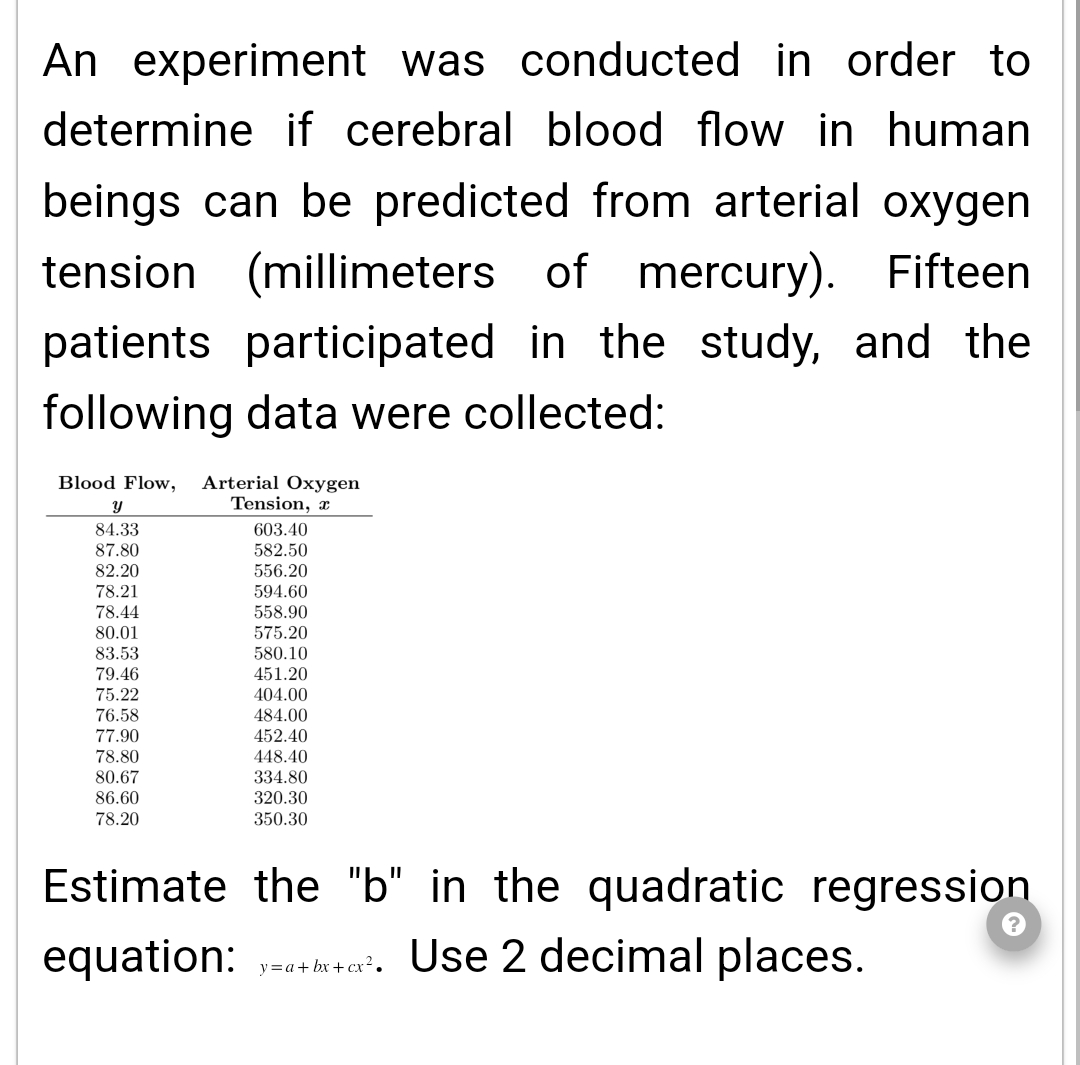
Transcribed Image Text:An experiment was conducted in order to
determine if cerebral blood flow in human
beings can be predicted from arterial oxygen
tension (millimeters of mercury). Fifteen
patients participated in the study, and the
following data were collected:
Blood Flow, Arterial Oxygen
Tension, a
Y
84.33
87.80
82.20
78.21
78.44
80.01
83.53
79.46
75.22
76.58
77.90
78.80
80.67
86.60
78.20
603.40
582.50
556.20
594.60
558.90
575.20
580.10
451.20
404.00
484.00
452.40
448.40
334.80
320.30
350.30
Estimate the "b" in the quadratic regression
equation: y=a+bx+cx². Use 2 decimal places.
Expert Solution
This question has been solved!
Explore an expertly crafted, step-by-step solution for a thorough understanding of key concepts.

Step by step
Solved in 2 steps with 1 images

Recommended textbooks for you
MATLAB: An Introduction with Applications
Statistics
ISBN:
9781119256830
Author:
Amos Gilat
Publisher:
John Wiley & Sons Inc

Probability and Statistics for Engineering and th…
Statistics
ISBN:
9781305251809
Author:
Jay L. Devore
Publisher:
Cengage Learning

Statistics for The Behavioral Sciences (MindTap C…
Statistics
ISBN:
9781305504912
Author:
Frederick J Gravetter, Larry B. Wallnau
Publisher:
Cengage Learning
MATLAB: An Introduction with Applications
Statistics
ISBN:
9781119256830
Author:
Amos Gilat
Publisher:
John Wiley & Sons Inc
Probability and Statistics for Engineering and th…
Statistics
ISBN:
9781305251809
Author:
Jay L. Devore
Publisher:
Cengage Learning
Statistics for The Behavioral Sciences (MindTap C…
Statistics
ISBN:
9781305504912
Author:
Frederick J Gravetter, Larry B. Wallnau
Publisher:
Cengage Learning

Elementary Statistics: Picturing the World (7th E…
Statistics
ISBN:
9780134683416
Author:
Ron Larson, Betsy Farber
Publisher:
PEARSON

The Basic Practice of Statistics
Statistics
ISBN:
9781319042578
Author:
David S. Moore, William I. Notz, Michael A. Fligner
Publisher:
W. H. Freeman

Introduction to the Practice of Statistics
Statistics
ISBN:
9781319013387
Author:
David S. Moore, George P. McCabe, Bruce A. Craig
Publisher:
W. H. Freeman