An important application of regression analysis in accounting is in the estimation of cost. By collecting data on volume and cost and using the least squares method to develop an estimated regression equation relating volume and cost, an accountant can estimate the cost associated with a particular manufacturing volume. Consider the following sample of production volumes and total cost data for a manufacturing operation. Production Volume (units) Total Cost ($) 400 450 550 600 700 750 3,900 4,900 5,300 5,800 6,300 6,900 a. Compute b1 and bo (to 1 decimal). 1 0 Complete the estimated regression equation (to 1 decimal). b. What is the variable cost per unit produced (to 1 decimal)? C. Compute the coefficient of determination (to 3 decimals). Note: report r between 0 and 1 What percentage of the variation in total cost can be explained by the production volume (to 1 decimal)? 0 d. The company's production schedule shows 500 units must be produced next month. What is the estimated total cost for this operation (to the nearest whole number)?
An important application of regression analysis in accounting is in the estimation of cost. By collecting data on volume and cost and using the least squares method to develop an estimated regression equation relating volume and cost, an accountant can estimate the cost associated with a particular manufacturing volume. Consider the following sample of production volumes and total cost data for a manufacturing operation. Production Volume (units) Total Cost ($) 400 450 550 600 700 750 3,900 4,900 5,300 5,800 6,300 6,900 a. Compute b1 and bo (to 1 decimal). 1 0 Complete the estimated regression equation (to 1 decimal). b. What is the variable cost per unit produced (to 1 decimal)? C. Compute the coefficient of determination (to 3 decimals). Note: report r between 0 and 1 What percentage of the variation in total cost can be explained by the production volume (to 1 decimal)? 0 d. The company's production schedule shows 500 units must be produced next month. What is the estimated total cost for this operation (to the nearest whole number)?

Elementary Linear Algebra (MindTap Course List)
8th Edition
ISBN:9781305658004
Author:Ron Larson
Publisher:Ron Larson
Chapter2: Matrices
Section2.CR: Review Exercises
Problem 89CR: Cellular Phone Subscribers The table shows the numbers of cellular phone subscribers y in millions...

Related questions
Question
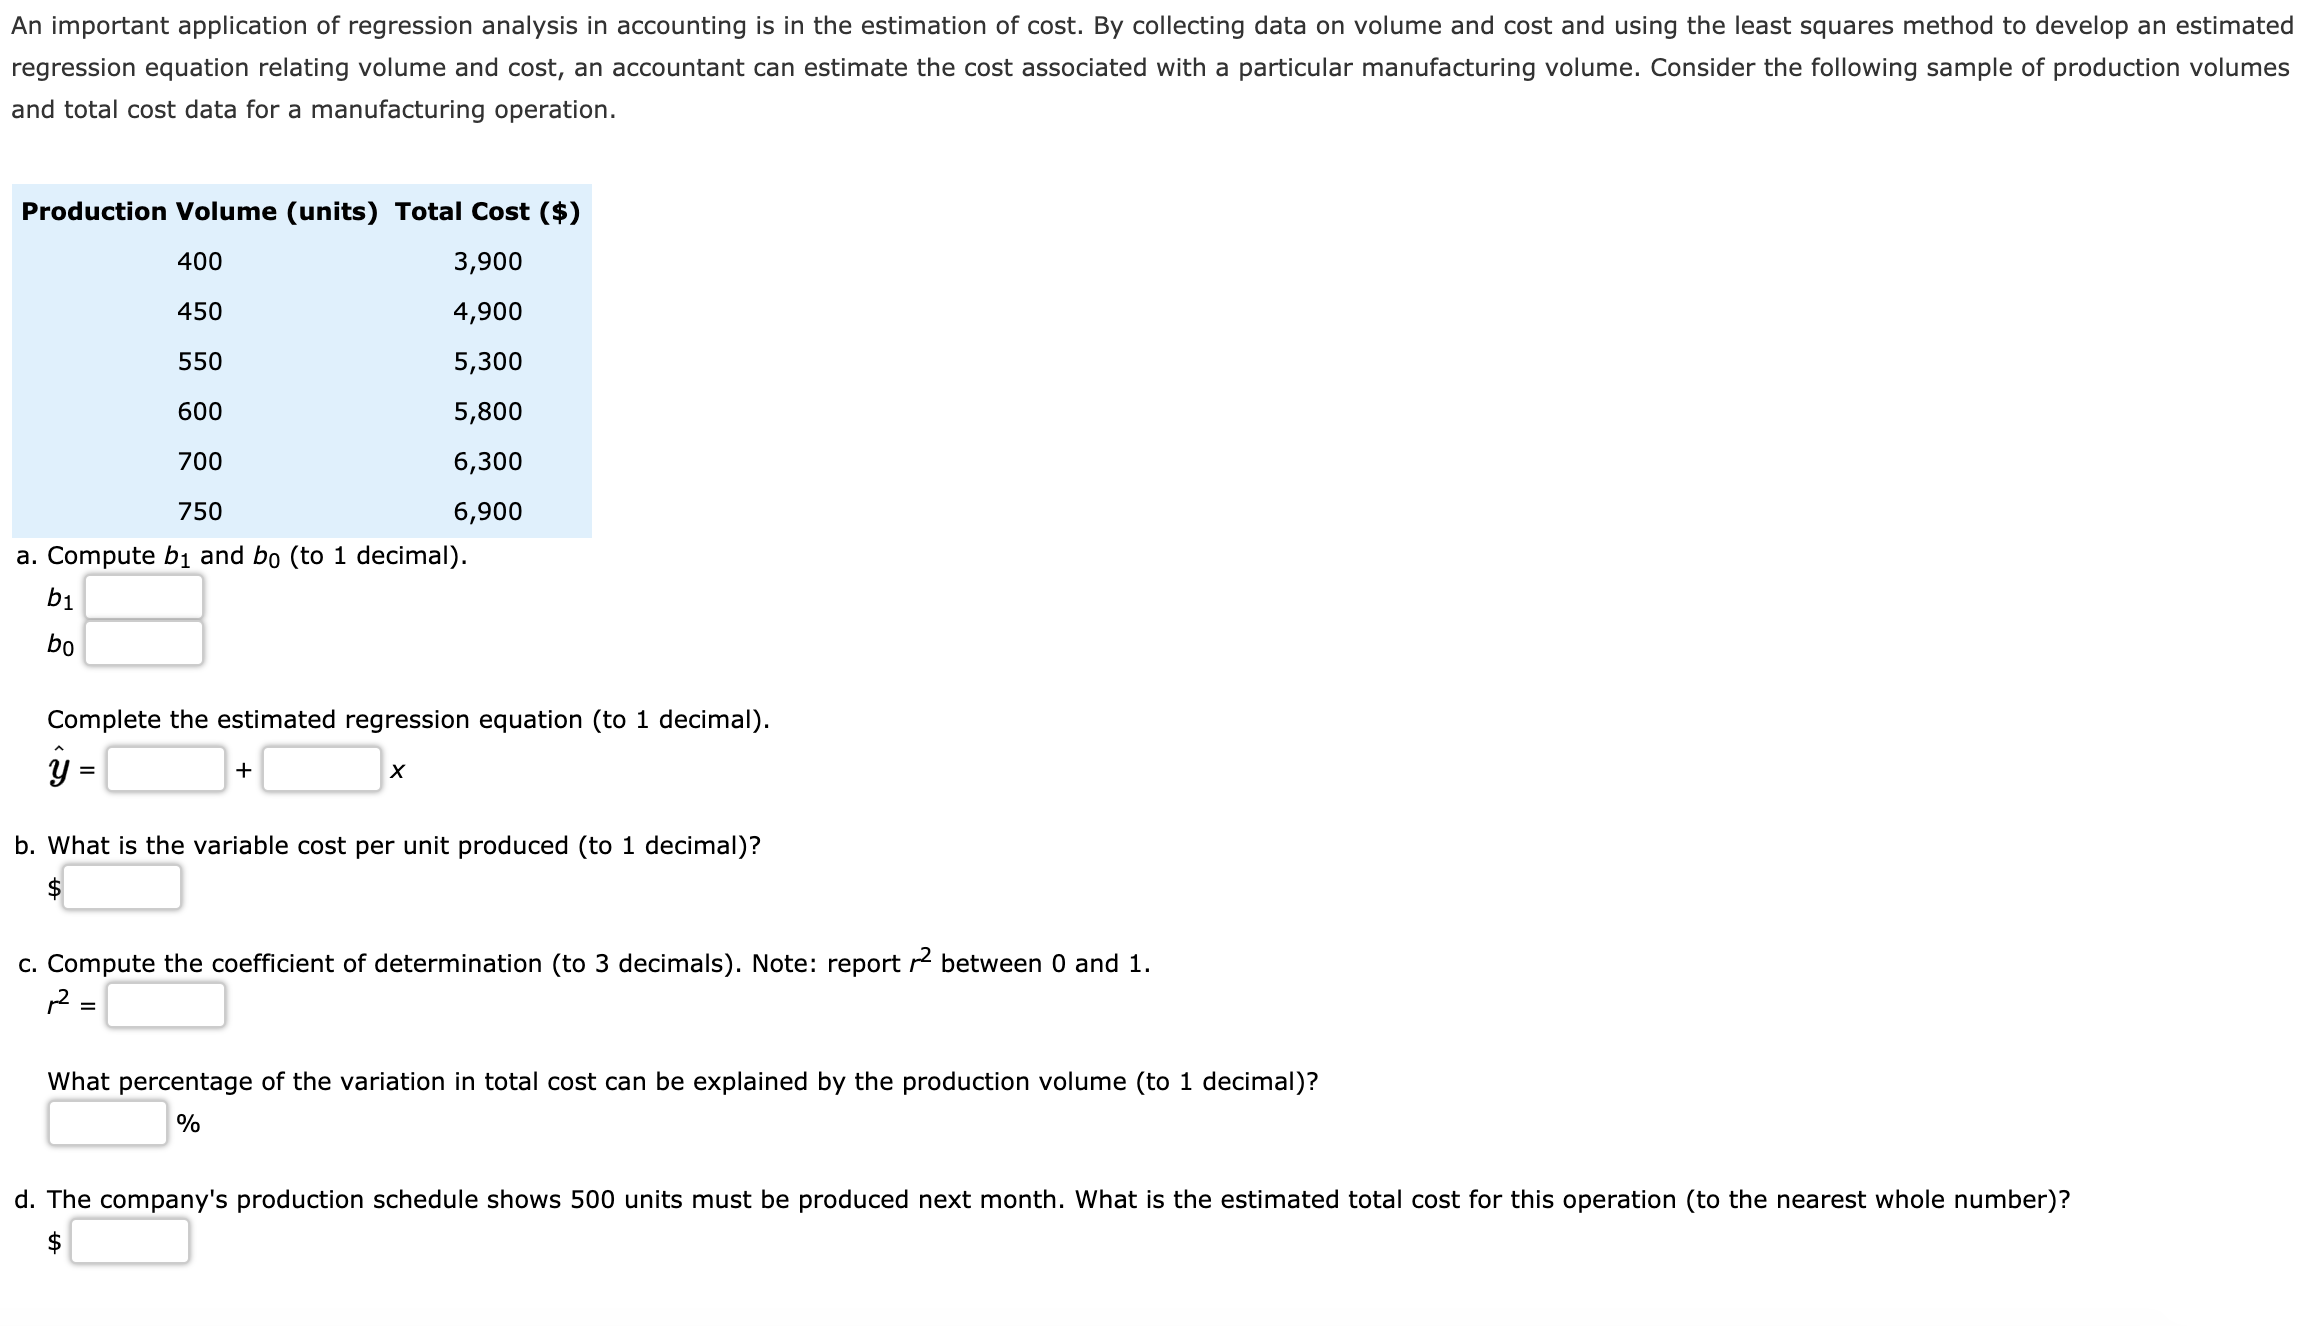
Transcribed Image Text:An important application of regression analysis in accounting is in the estimation of cost. By collecting data on volume and cost and using the least squares method to develop an estimated
regression equation relating volume and cost, an accountant can estimate the cost associated with a particular manufacturing volume. Consider the following sample of production volumes
and total cost data for a manufacturing operation.
Production Volume (units) Total Cost ($)
400
450
550
600
700
750
3,900
4,900
5,300
5,800
6,300
6,900
a. Compute b1 and bo (to 1 decimal).
1
0
Complete the estimated regression equation (to 1 decimal).
b. What is the variable cost per unit produced (to 1 decimal)?
C. Compute the coefficient of determination (to 3 decimals). Note: report r between 0 and 1
What percentage of the variation in total cost can be explained by the production volume (to 1 decimal)?
0
d. The company's production schedule shows 500 units must be produced next month. What is the estimated total cost for this operation (to the nearest whole number)?
Expert Solution
This question has been solved!
Explore an expertly crafted, step-by-step solution for a thorough understanding of key concepts.

This is a popular solution!

Trending now
This is a popular solution!

Step by step
Solved in 5 steps with 3 images

Recommended textbooks for you
Elementary Linear Algebra (MindTap Course List)
Algebra
ISBN:
9781305658004
Author:
Ron Larson
Publisher:
Cengage Learning

Linear Algebra: A Modern Introduction
Algebra
ISBN:
9781285463247
Author:
David Poole
Publisher:
Cengage Learning

Elementary Linear Algebra (MindTap Course List)
Algebra
ISBN:
9781305658004
Author:
Ron Larson
Publisher:
Cengage Learning
Linear Algebra: A Modern Introduction
Algebra
ISBN:
9781285463247
Author:
David Poole
Publisher:
Cengage Learning