An engineer wants to determine how the weight of a car, x, affects gas mileage, y. The following data represent the weights of various cars and their miles per gallon C D E Car A 2505 3095 3400 3855 4170 31.2 27.6 Weight (pounds), x Miles per Gallon, y 27.6 21.2 21.1 (a) Find the least-squares regression line treating weight as the explanatory variable and miles per gallon as the response variable. Write the equation for the least-squares regression line. (Round the x coefficient to five decimal places as needed. Round the constant to one decimal place as needed.) b) Interpret the slope and intercept, if appropriate (c) Predict the miles per gallon of car Upper BB and compute the residual. Is the miles per gallon of this car above average or below average for cars of this weight? d) Draw the least-squares regression line on the scatter diagram of the data and label the residual.
An engineer wants to determine how the weight of a car, x, affects gas mileage, y. The following data represent the weights of various cars and their miles per gallon C D E Car A 2505 3095 3400 3855 4170 31.2 27.6 Weight (pounds), x Miles per Gallon, y 27.6 21.2 21.1 (a) Find the least-squares regression line treating weight as the explanatory variable and miles per gallon as the response variable. Write the equation for the least-squares regression line. (Round the x coefficient to five decimal places as needed. Round the constant to one decimal place as needed.) b) Interpret the slope and intercept, if appropriate (c) Predict the miles per gallon of car Upper BB and compute the residual. Is the miles per gallon of this car above average or below average for cars of this weight? d) Draw the least-squares regression line on the scatter diagram of the data and label the residual.

Elementary Linear Algebra (MindTap Course List)
8th Edition
ISBN:9781305658004
Author:Ron Larson
Publisher:Ron Larson
Chapter2: Matrices
Section2.CR: Review Exercises
Problem 90CR

Related questions
Question
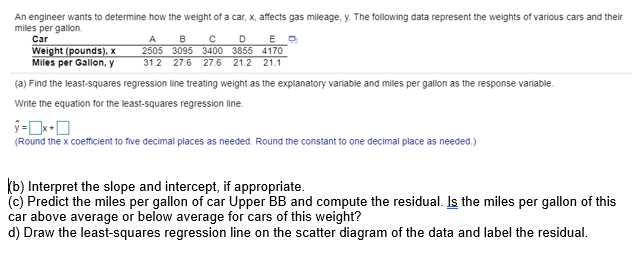
Transcribed Image Text:An engineer wants to determine how the weight of a car, x, affects gas mileage, y. The following data represent the weights of various cars and their
miles per gallon
C
D
E
Car
A
2505 3095 3400 3855 4170
31.2 27.6
Weight (pounds), x
Miles per Gallon, y
27.6 21.2 21.1
(a) Find the least-squares regression line treating weight as the explanatory variable and miles per gallon as the response variable.
Write the equation for the least-squares regression line.
(Round the x coefficient to five decimal places as needed. Round the constant to one decimal place as needed.)
b) Interpret the slope and intercept, if appropriate
(c) Predict the miles per gallon of car Upper BB and compute the residual. Is the miles per gallon of this
car above average or below average for cars of this weight?
d) Draw the least-squares regression line on the scatter diagram of the data and label the residual.
Expert Solution
This question has been solved!
Explore an expertly crafted, step-by-step solution for a thorough understanding of key concepts.

This is a popular solution!

Trending now
This is a popular solution!

Step by step
Solved in 7 steps with 6 images

Recommended textbooks for you
Elementary Linear Algebra (MindTap Course List)
Algebra
ISBN:
9781305658004
Author:
Ron Larson
Publisher:
Cengage Learning

Linear Algebra: A Modern Introduction
Algebra
ISBN:
9781285463247
Author:
David Poole
Publisher:
Cengage Learning

Glencoe Algebra 1, Student Edition, 9780079039897…
Algebra
ISBN:
9780079039897
Author:
Carter
Publisher:
McGraw Hill
Elementary Linear Algebra (MindTap Course List)
Algebra
ISBN:
9781305658004
Author:
Ron Larson
Publisher:
Cengage Learning
Linear Algebra: A Modern Introduction
Algebra
ISBN:
9781285463247
Author:
David Poole
Publisher:
Cengage Learning
Glencoe Algebra 1, Student Edition, 9780079039897…
Algebra
ISBN:
9780079039897
Author:
Carter
Publisher:
McGraw Hill