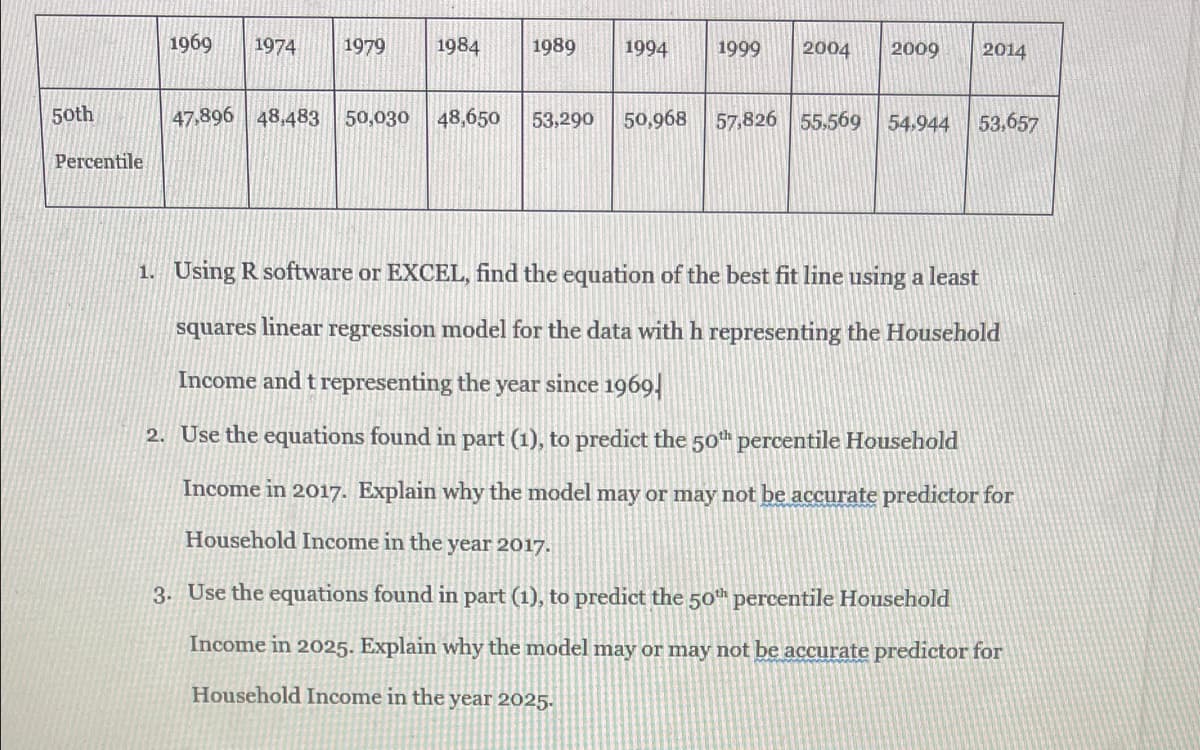
1969 1974 1979 1984 1989 1994 1999 2004 2009 2014 50th 47,896 48,483 50,030 48,650 53,290 50,968 57,826 55.569 54,944 53,657 Percentile 1. Using R software or EXCEL, find the equation of the best fit line using a least squares linear regression model for the data with h representing the Household Income and t representing the year since 1969, 2. Use the equations found in part (1), to predict the 50th percentile Household Income in 2017. Explain why the model may or may not be accurate predictor for Household Income in the year 2017. 3. Use the equations found in part (1), to predict the 50th percentile Household Income in 2025. Explain why the model may or may not be accurate predictor for Household Income in the year 2025.
1969 1974 1979 1984 1989 1994 1999 2004 2009 2014 50th 47,896 48,483 50,030 48,650 53,290 50,968 57,826 55.569 54,944 53,657 Percentile 1. Using R software or EXCEL, find the equation of the best fit line using a least squares linear regression model for the data with h representing the Household Income and t representing the year since 1969, 2. Use the equations found in part (1), to predict the 50th percentile Household Income in 2017. Explain why the model may or may not be accurate predictor for Household Income in the year 2017. 3. Use the equations found in part (1), to predict the 50th percentile Household Income in 2025. Explain why the model may or may not be accurate predictor for Household Income in the year 2025.

Glencoe Algebra 1, Student Edition, 9780079039897, 0079039898, 2018
18th Edition
ISBN:9780079039897
Author:Carter
Publisher:Carter
Chapter4: Equations Of Linear Functions
Section4.6: Regression And Median-fit Lines
Problem 22PFA

Related questions
Question
Transcribed Image Text:1969
1974
1979
1984
1989
1994
1999
2004
2009
2014
50th
47,896 48,483 50,030
48,650
53,290
50,968
57,826 55.569
54,944
53,657
Percentile
1. Using R software or EXCEL, find the equation of the best fit line using a least
squares linear regression model for the data with h representing the Household
Income and t representing the year since 1969,
2. Use the equations found in part (1), to predict the 50th percentile Household
Income in 2017. Explain why the model may or may not be accurate predictor for
Household Income in the year 2017.
3. Use the equations found in part (1), to predict the 50h percentile Household
Income in 2025. Explain why the model may or may ot be accurate predictor for
Household Income in the year 2025.
Expert Solution
This question has been solved!
Explore an expertly crafted, step-by-step solution for a thorough understanding of key concepts.

Step by step
Solved in 4 steps with 2 images

Recommended textbooks for you
Glencoe Algebra 1, Student Edition, 9780079039897…
Algebra
ISBN:
9780079039897
Author:
Carter
Publisher:
McGraw Hill


Functions and Change: A Modeling Approach to Coll…
Algebra
ISBN:
9781337111348
Author:
Bruce Crauder, Benny Evans, Alan Noell
Publisher:
Cengage Learning
Glencoe Algebra 1, Student Edition, 9780079039897…
Algebra
ISBN:
9780079039897
Author:
Carter
Publisher:
McGraw Hill
Functions and Change: A Modeling Approach to Coll…
Algebra
ISBN:
9781337111348
Author:
Bruce Crauder, Benny Evans, Alan Noell
Publisher:
Cengage Learning

College Algebra
Algebra
ISBN:
9781305115545
Author:
James Stewart, Lothar Redlin, Saleem Watson
Publisher:
Cengage Learning

Algebra & Trigonometry with Analytic Geometry
Algebra
ISBN:
9781133382119
Author:
Swokowski
Publisher:
Cengage

Elementary Linear Algebra (MindTap Course List)
Algebra
ISBN:
9781305658004
Author:
Ron Larson
Publisher:
Cengage Learning