An important application of regression analysis in accounting is in the estimation of cost. By collecting data on volume and cost and using the least squares method to develop an estimated regression equation relating volume and cost, an accountant can estimate the cost associated with a particular manufacturing volume. Consider the following sample of production volumes and total cost data for a manufacturing operation. Production Volume (units) Total Cost ($) 350 3800 400 4600 450 5500 550 6300 650 7000 750 7400 -select your answer choices- c. Based on one month, $6,000 (is, is not) outside the upper limit of the prediction interval. A sequence of five to seven months with consistently high costs should cause concern.
An important application of regression analysis in accounting is in the estimation of cost. By collecting data on volume and cost and using the least squares method to develop an estimated regression equation relating volume and cost, an accountant can estimate the cost associated with a particular manufacturing volume. Consider the following sample of production volumes and total cost data for a manufacturing operation. Production Volume (units) Total Cost ($) 350 3800 400 4600 450 5500 550 6300 650 7000 750 7400 -select your answer choices- c. Based on one month, $6,000 (is, is not) outside the upper limit of the prediction interval. A sequence of five to seven months with consistently high costs should cause concern.

Elementary Linear Algebra (MindTap Course List)
8th Edition
ISBN:9781305658004
Author:Ron Larson
Publisher:Ron Larson
Chapter2: Matrices
Section2.CR: Review Exercises
Problem 89CR: Cellular Phone Subscribers The table shows the numbers of cellular phone subscribers y in millions...

Related questions
Question
100%
An important application of
| Production Volume (units) | Total Cost ($) |
| 350 | 3800 |
| 400 | 4600 |
| 450 | 5500 |
| 550 | 6300 |
| 650 | 7000 |
| 750 | 7400 |
-select your answer choices-
c. Based on one month, $6,000 (is, is not) outside the upper limit of the prediction interval. A sequence of five to seven months with consistently high costs should cause concern.
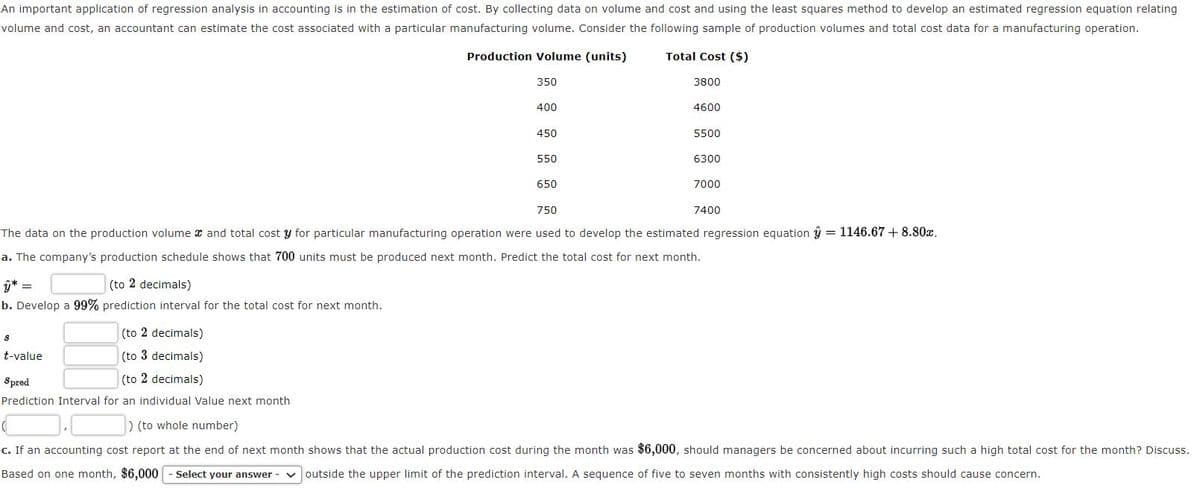
Transcribed Image Text:An important application of regression analysis in accounting is in the estimation of cost. By collecting data on volume and cost and using the least squares method to develop
estimated regression equation relating
volume and cost, an accountant can estimate the cost associated with a particular manufacturing volume. Consider the following sample of production volumes and total cost data for a manufacturing operation.
Production Volume (units)
Total Cost ($)
350
3800
400
4600
450
5500
550
6300
650
7000
750
7400
The data on the production volume x and total cost y for particular manufacturing operation were used to develop the estimated regression equation ŷ = 1146.67 + 8.80x.
a. The company's production schedule shows that 700 units must be produced next month. Predict the total cost for next month.
(to 2 decimals)
ŷ* =
b. Develop a 99% prediction interval for the total cost for next month.
(to 2 decimals)
t-value
(to 3 decimals)
Spred
(to 2 decimals)
Prediction Interval for an individual Value next month
) (to whole number)
c. If an accounting cost report at the end of next month shows that the actual production cost during the month was $6,000, should managers be concerned about incurring such a high total cost for the month? Discuss.
Based on one month, $6,000
Select your answer
outside the upper limit of the prediction interval. A sequence of five to seven months with consistently high costs should cause concern.
Expert Solution
This question has been solved!
Explore an expertly crafted, step-by-step solution for a thorough understanding of key concepts.

Step by step
Solved in 2 steps

Recommended textbooks for you
Elementary Linear Algebra (MindTap Course List)
Algebra
ISBN:
9781305658004
Author:
Ron Larson
Publisher:
Cengage Learning

Functions and Change: A Modeling Approach to Coll…
Algebra
ISBN:
9781337111348
Author:
Bruce Crauder, Benny Evans, Alan Noell
Publisher:
Cengage Learning

Linear Algebra: A Modern Introduction
Algebra
ISBN:
9781285463247
Author:
David Poole
Publisher:
Cengage Learning
Elementary Linear Algebra (MindTap Course List)
Algebra
ISBN:
9781305658004
Author:
Ron Larson
Publisher:
Cengage Learning
Functions and Change: A Modeling Approach to Coll…
Algebra
ISBN:
9781337111348
Author:
Bruce Crauder, Benny Evans, Alan Noell
Publisher:
Cengage Learning
Linear Algebra: A Modern Introduction
Algebra
ISBN:
9781285463247
Author:
David Poole
Publisher:
Cengage Learning


Algebra & Trigonometry with Analytic Geometry
Algebra
ISBN:
9781133382119
Author:
Swokowski
Publisher:
Cengage