An independent-samples t-test provides the following data: t-obt is 2.66, t-crit is 2.086 What is the correct statistical conclusion here?
An independent-samples t-test provides the following data: t-obt is 2.66, t-crit is 2.086 What is the correct statistical conclusion here?

College Algebra (MindTap Course List)
12th Edition
ISBN:9781305652231
Author:R. David Gustafson, Jeff Hughes
Publisher:R. David Gustafson, Jeff Hughes
Chapter8: Sequences, Series, And Probability
Section8.7: Probability
Problem 58E: What is meant by the sample space of an experiment?

Related questions
Question
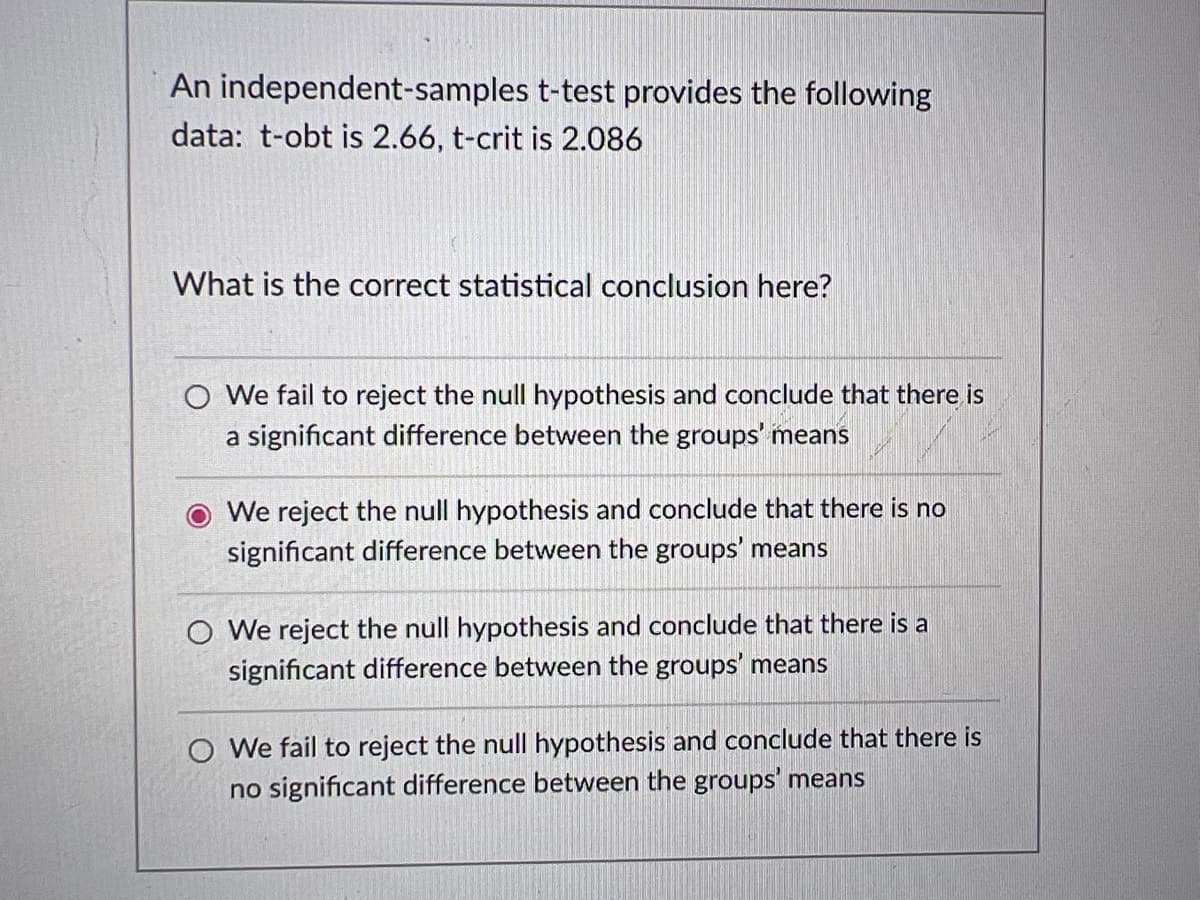
Transcribed Image Text:An independent-samples t-test provides the following
data: t-obt is 2.66, t-crit is 2.086
What is the correct statistical conclusion here?
O We fail to reject the null hypothesis and conclude that there is
a significant difference between the groups' means
We reject the null hypothesis and conclude that there is no
significant difference between the groups' means
O We reject the null hypothesis and conclude that there is a
significant difference between the groups' means
O We fail to reject the null hypothesis and conclude that there is
no significant difference between the groups' means
Expert Solution
This question has been solved!
Explore an expertly crafted, step-by-step solution for a thorough understanding of key concepts.

This is a popular solution!

Trending now
This is a popular solution!

Step by step
Solved in 2 steps

Recommended textbooks for you
College Algebra (MindTap Course List)
Algebra
ISBN:
9781305652231
Author:
R. David Gustafson, Jeff Hughes
Publisher:
Cengage Learning
College Algebra (MindTap Course List)
Algebra
ISBN:
9781305652231
Author:
R. David Gustafson, Jeff Hughes
Publisher:
Cengage Learning