An insurance company collects data on seat-belt use among drivers in a country. Of 1600 drivers 30-39 years old, 25% said that they data suggest that there is a difference in seat-belt use between drivers 30-39 years old and those 55-64? Let population 1 be drivers of age 30-39 and let population 2 be drivers of age 55-64. Use the two-proportions z-test to conduct the required hypothesis test. What are the hypotheses for this test? OA. Ho: P₁ P2, H₂: P1 P2 OB. Ho: P₁ P2. Ha: P1 P2 OC. Ho: P₁ P2, H₂: P1 = P2 OD. Ho: P₁ P2. Ha: P1 P₂2 OE. Ho: P₁ P2, H₂: P1 P2 OF. Ho: P₁
An insurance company collects data on seat-belt use among drivers in a country. Of 1600 drivers 30-39 years old, 25% said that they data suggest that there is a difference in seat-belt use between drivers 30-39 years old and those 55-64? Let population 1 be drivers of age 30-39 and let population 2 be drivers of age 55-64. Use the two-proportions z-test to conduct the required hypothesis test. What are the hypotheses for this test? OA. Ho: P₁ P2, H₂: P1 P2 OB. Ho: P₁ P2. Ha: P1 P2 OC. Ho: P₁ P2, H₂: P1 = P2 OD. Ho: P₁ P2. Ha: P1 P₂2 OE. Ho: P₁ P2, H₂: P1 P2 OF. Ho: P₁

College Algebra (MindTap Course List)
12th Edition
ISBN:9781305652231
Author:R. David Gustafson, Jeff Hughes
Publisher:R. David Gustafson, Jeff Hughes
Chapter8: Sequences, Series, And Probability
Section8.7: Probability
Problem 5E: List the sample space of each experiment. Rolling one die and tossing one coin

Related questions
Question
USE STATCRUNCH TO SHOW WORK
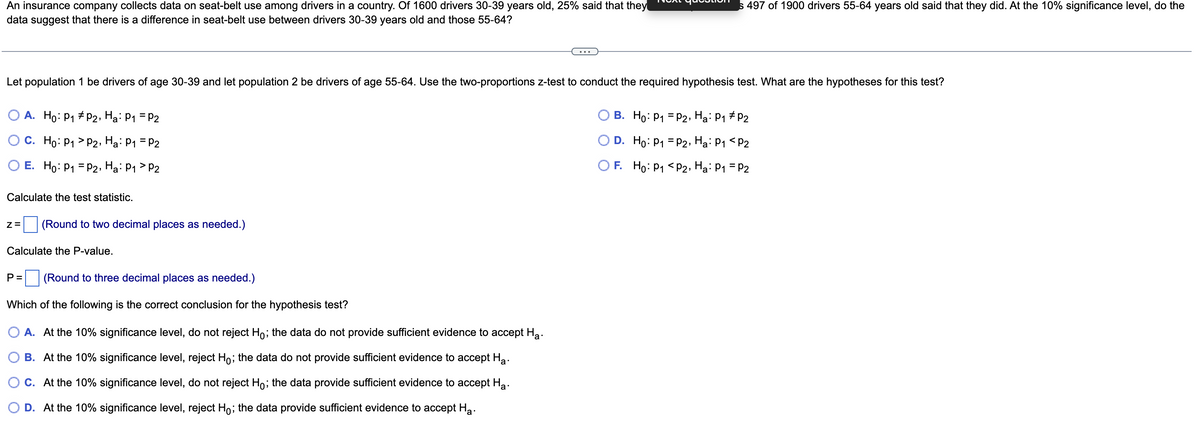
Transcribed Image Text:An insurance company collects data on seat-belt use among drivers in a country. Of 1600 drivers 30-39 years old, 25% said that they
data suggest that there is a difference in seat-belt use between drivers 30-39 years old and those 55-64?
Let population 1 be drivers of age 30-39 and let population 2 be drivers of age 55-64. Use the two-proportions z-test to conduct the required hypothesis test. What are the hypotheses for this test?
P2, Ha: P₁ = P2
B. Ho: P₁ P2, Ha: P1 P₂
O A. Ho: P₁
C. Ho: P₁
P2, Ha: P₁ = P2
O D. Ho: P1 = P2, Ha: P₁ <P2
E. Ho: P₁ = P2, Ha: P1 P2
OF.
Ho: P₁
P2, Ha: P₁ = P2
Calculate the test statistic.
Z= (Round to two decimal places as needed.)
Calculate the P-value.
P = (Round to three decimal places as needed.)
Which of the following is the correct conclusion for the hypothesis test?
A. At the 10% significance level, do not reject Ho; the data do not provide sufficient evidence to accept Ha.
B. At the 10% significance level, reject Hỏ; the data do not provide sufficient evidence to accept Ha.
C. At the 10% significance level, do not reject Ho; the data provide sufficient evidence to accept Ha.
D. At the 10% significance level, reject Ho; the data provide sufficient evidence to accept Ha.
s 497 of 1900 drivers 55-64 years old said that they did. At the 10% significance level, do the
Expert Solution
This question has been solved!
Explore an expertly crafted, step-by-step solution for a thorough understanding of key concepts.

This is a popular solution!

Trending now
This is a popular solution!

Step by step
Solved in 3 steps with 4 images

Recommended textbooks for you
College Algebra (MindTap Course List)
Algebra
ISBN:
9781305652231
Author:
R. David Gustafson, Jeff Hughes
Publisher:
Cengage Learning

College Algebra (MindTap Course List)
Algebra
ISBN:
9781305652231
Author:
R. David Gustafson, Jeff Hughes
Publisher:
Cengage Learning