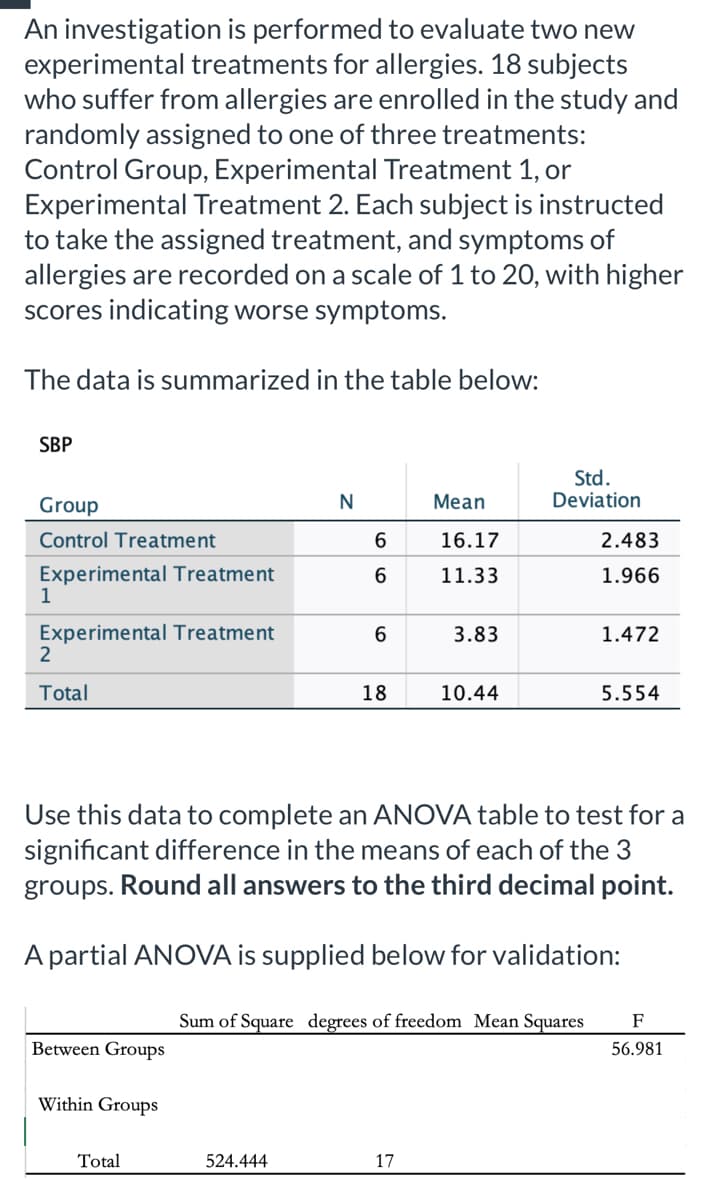
An investigation is performed to evaluate two new experimental treatments for allergies. 18 subjects who suffer from allergies are enrolled in the study and randomly assigned to one of three treatments: Control Group, Experimental Treatment 1, or Experimental Treatment 2. Each subject is instructed to take the assigned treatment, and symptoms of allergies are recorded on a scale of 1 to 20, with higher scores indicating worse symptoms.
An investigation is performed to evaluate two new experimental treatments for allergies. 18 subjects who suffer from allergies are enrolled in the study and randomly assigned to one of three treatments: Control Group, Experimental Treatment 1, or Experimental Treatment 2. Each subject is instructed to take the assigned treatment, and symptoms of allergies are recorded on a scale of 1 to 20, with higher scores indicating worse symptoms.

Glencoe Algebra 1, Student Edition, 9780079039897, 0079039898, 2018
18th Edition
ISBN:9780079039897
Author:Carter
Publisher:Carter
Chapter10: Statistics
Section10.6: Summarizing Categorical Data
Problem 25PPS

Related questions
Question
100%
Transcribed Image Text:An investigation is performed to evaluate two new
experimental treatments for allergies. 18 subjects
who suffer from allergies are enrolled in the study and
randomly assigned to one of three treatments:
Control Group, Experimental Treatment 1, or
Experimental Treatment 2. Each subject is instructed
to take the assigned treatment, and symptoms of
allergies are recorded on a scale of 1 to 20, with higher
scores indicating worse symptoms.
The data is summarized in the table below:
SBP
Std.
Deviation
Group
N
Mean
Control Treatment
16.17
2.483
Experimental Treatment
1
11.33
1.966
Experimental Treatment
3.83
1.472
Total
18
10.44
5.554
Use this data to complete an ANOVA table to test for a
significant difference in the means of each of the 3
groups. Round all answers to the third decimal point.
A partial ANOVA is supplied below for validation:
Sum of Square degrees of freedom Mean Squares
F
Between Groups
56.981
Within Groups
Total
524.444
17
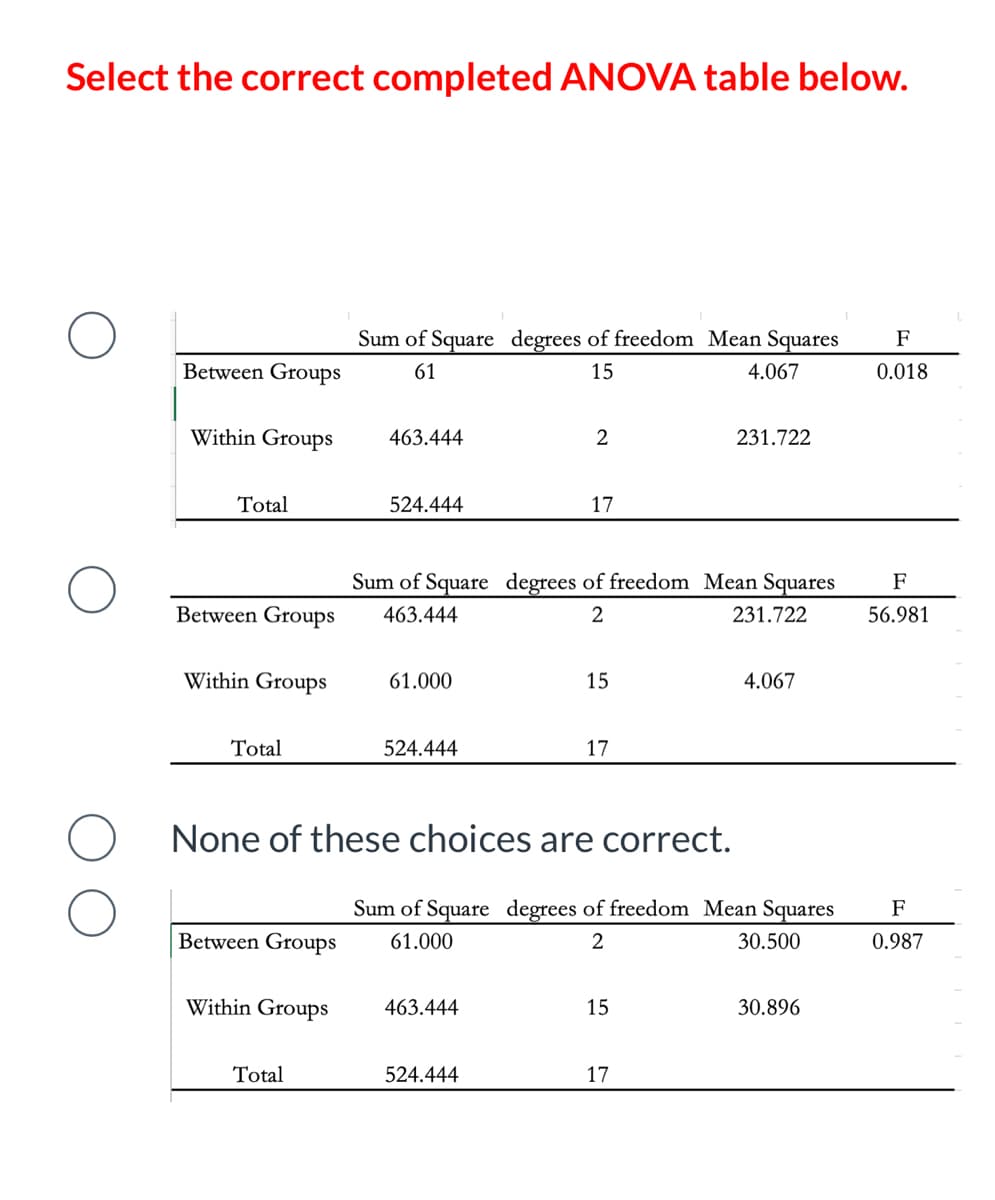
Transcribed Image Text:Select the correct completed ANOVA table below.
Sum of Square degrees of freedom Mean Squares
F
Between Groups
61
15
4.067
0.018
Within Groups
463.444
2
231.722
Total
524.444
17
Sum of Square degrees of freedom Mean Squares
F
Between Groups
463.444
2
231.722
56.981
Within Groups
61.000
15
4.067
Total
524.444
17
None of these choices are correct.
Sum of Square degrees of freedom Mean Squares
F
Between Groups
61.000
2
30.500
0.987
Within Groups
463.444
15
30.896
Total
524.444
17
Expert Solution
This question has been solved!
Explore an expertly crafted, step-by-step solution for a thorough understanding of key concepts.

This is a popular solution!

Trending now
This is a popular solution!

Step by step
Solved in 3 steps

Recommended textbooks for you
Glencoe Algebra 1, Student Edition, 9780079039897…
Algebra
ISBN:
9780079039897
Author:
Carter
Publisher:
McGraw Hill
Glencoe Algebra 1, Student Edition, 9780079039897…
Algebra
ISBN:
9780079039897
Author:
Carter
Publisher:
McGraw Hill