An online math tutor service would like to claim that the average time spent taking a standardized test after students go through tutoring is less than the average time spent before going through tutoring. A simple random sample of students takes a pre-test, then goes through tutoring and takes a post-test. Results of the sample are shown below. Before After What are the population parameters? Mean 82.333 74.944 Variance 110.118 199.820 Pick Observations 18 18 Pearson Correlation 0.727 Hypothesized Mean Difference Is the two-sample hypothesis test a paired t-test or an unpaired t-test? df 17 t Stat -3.227 Pick P(Tet) one-tail t Critical one-tail P(Tct) two-tail t Critical two-tail Confidence Level 0.002 -1.740 0.005 What is the level of significance? Ex: 0.12 -2.110 99% What is the null hypothesis Ho ? Pick What is the alternative hypothesis H,? Pick Should Ho be rejected or does Ho fail to be rejected? Pick What conclusion can be drawn from the data? Pick v evidence exists to support the claim that the mean time spent taking a test after tutoring is less than the mean time spent taking a test before tutoring. 21
An online math tutor service would like to claim that the average time spent taking a standardized test after students go through tutoring is less than the average time spent before going through tutoring. A simple random sample of students takes a pre-test, then goes through tutoring and takes a post-test. Results of the sample are shown below. Before After What are the population parameters? Mean 82.333 74.944 Variance 110.118 199.820 Pick Observations 18 18 Pearson Correlation 0.727 Hypothesized Mean Difference Is the two-sample hypothesis test a paired t-test or an unpaired t-test? df 17 t Stat -3.227 Pick P(Tet) one-tail t Critical one-tail P(Tct) two-tail t Critical two-tail Confidence Level 0.002 -1.740 0.005 What is the level of significance? Ex: 0.12 -2.110 99% What is the null hypothesis Ho ? Pick What is the alternative hypothesis H,? Pick Should Ho be rejected or does Ho fail to be rejected? Pick What conclusion can be drawn from the data? Pick v evidence exists to support the claim that the mean time spent taking a test after tutoring is less than the mean time spent taking a test before tutoring. 21

MATLAB: An Introduction with Applications
6th Edition
ISBN:9781119256830
Author:Amos Gilat
Publisher:Amos Gilat
Chapter1: Starting With Matlab
Section: Chapter Questions
Problem 1P

Related questions
Question
Transcribed Image Text:Jump to level 1
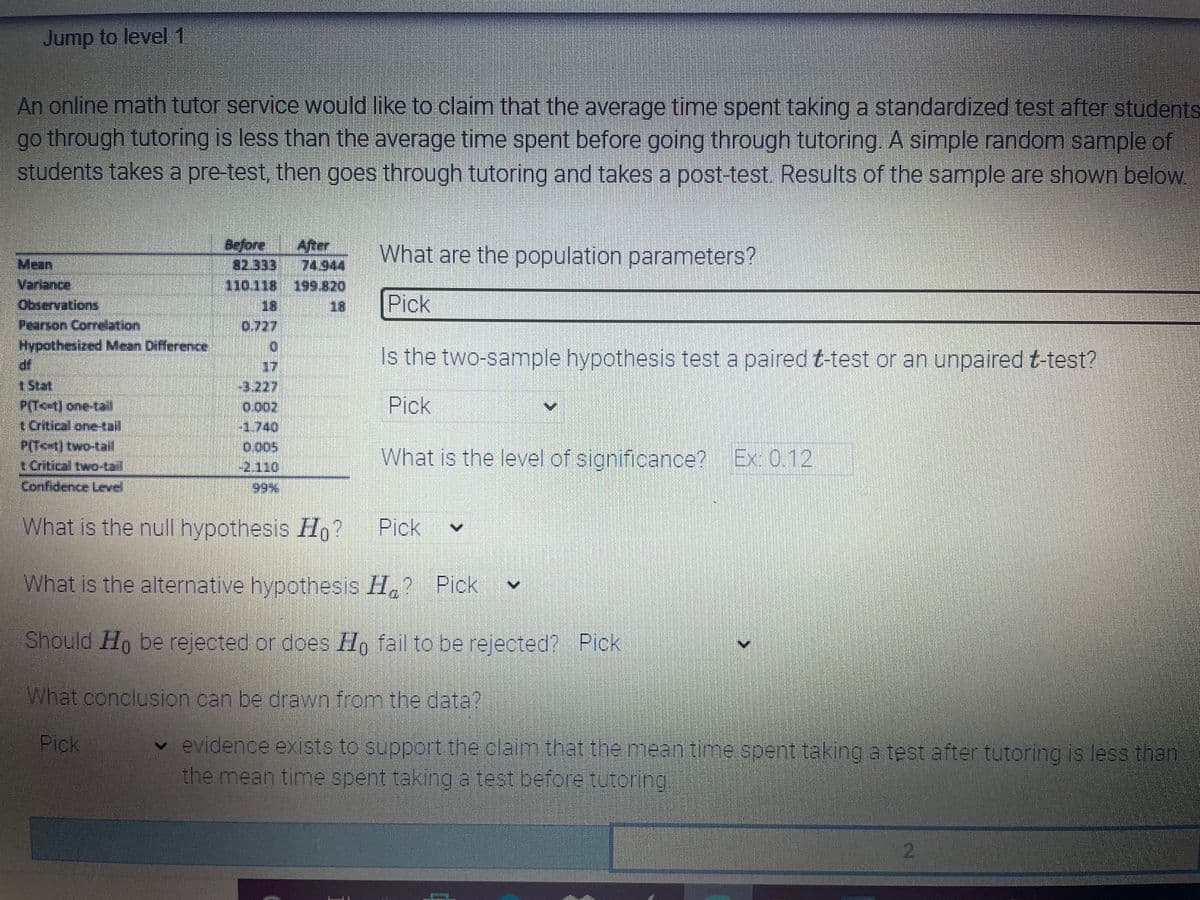
An online math tutor service would like to claim that the average time spent taking a standardized test after students
go through tutoring is less than the average time spent before going through tutoring. A simple random sample of
students takes a pre-test, then goes through tutoring and takes a post-test. Results of the sample are shown below.
కిలంగ
82.333
After
74.944
110.118 199820
18
What are the population parameters?
Mean
Variance
Observations
Pearson Comelation
Hypothesized Mean Difference
18
Pick
0.727
Is the two-sample hypothesis test a paired t-test or an unpaired t-test?
17
1Stat
-3.227
Pick
P(T<+t) one-tail
டபnoloneinl
Pो०il two-tail
t Critical two-tail
-1.740
0,005
What is the level of significance? Ex: 012
-2.110
Confidence Level
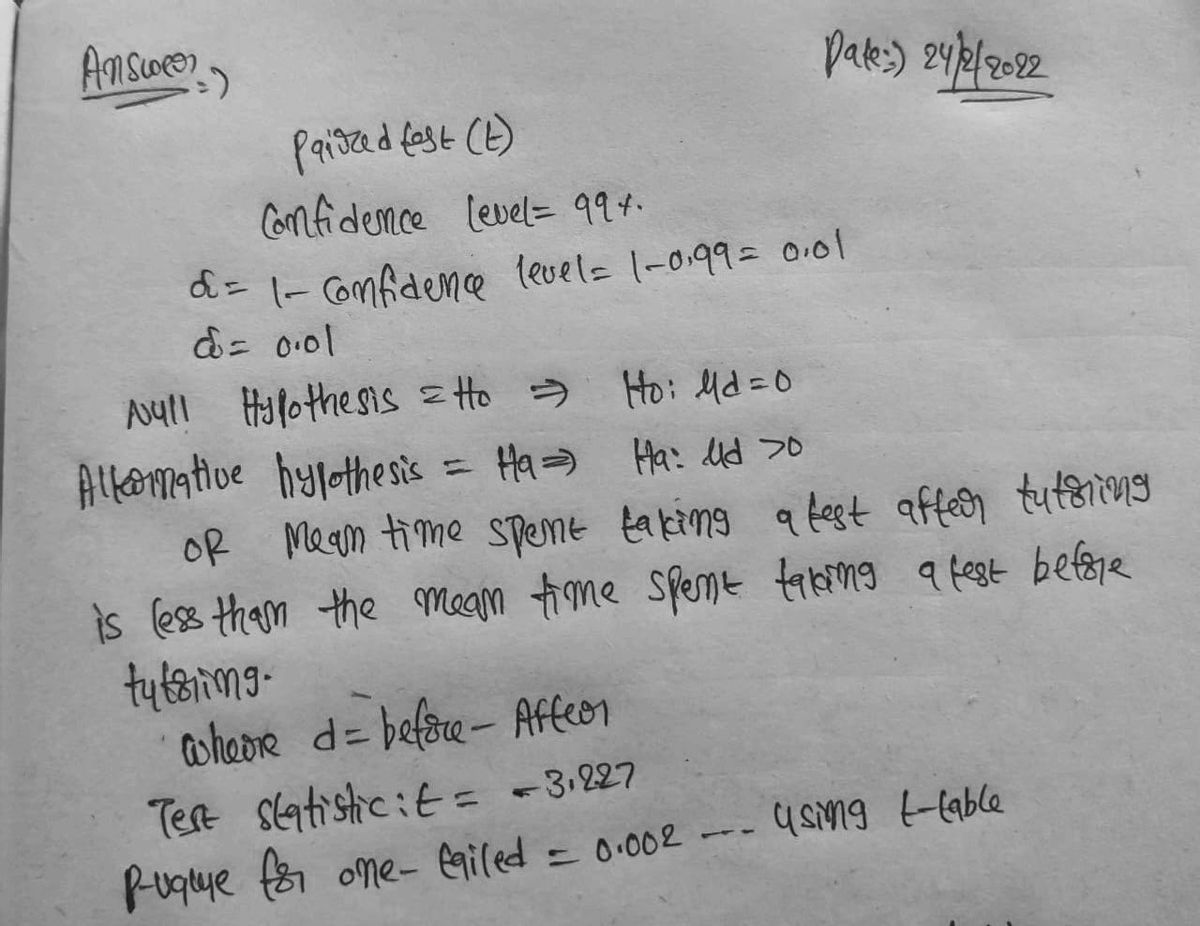
What is the null hypothesis Ho?
Pick
What is the alternative hypothesis H,? Pick
Should Ho be rejected or does Ho fail to be rejected? Pick
What conclusion can be drawn from the data?
Pick
v evidence exists to support the claim that the mean time spent taking a test after tutoring is less than
the mean time spent taking a test before tutoring.
L2
Expert Solution
Step 1

Trending now
This is a popular solution!

Step by step
Solved in 2 steps with 2 images

Recommended textbooks for you
MATLAB: An Introduction with Applications
Statistics
ISBN:
9781119256830
Author:
Amos Gilat
Publisher:
John Wiley & Sons Inc

Probability and Statistics for Engineering and th…
Statistics
ISBN:
9781305251809
Author:
Jay L. Devore
Publisher:
Cengage Learning

Statistics for The Behavioral Sciences (MindTap C…
Statistics
ISBN:
9781305504912
Author:
Frederick J Gravetter, Larry B. Wallnau
Publisher:
Cengage Learning
MATLAB: An Introduction with Applications
Statistics
ISBN:
9781119256830
Author:
Amos Gilat
Publisher:
John Wiley & Sons Inc
Probability and Statistics for Engineering and th…
Statistics
ISBN:
9781305251809
Author:
Jay L. Devore
Publisher:
Cengage Learning
Statistics for The Behavioral Sciences (MindTap C…
Statistics
ISBN:
9781305504912
Author:
Frederick J Gravetter, Larry B. Wallnau
Publisher:
Cengage Learning

Elementary Statistics: Picturing the World (7th E…
Statistics
ISBN:
9780134683416
Author:
Ron Larson, Betsy Farber
Publisher:
PEARSON

The Basic Practice of Statistics
Statistics
ISBN:
9781319042578
Author:
David S. Moore, William I. Notz, Michael A. Fligner
Publisher:
W. H. Freeman

Introduction to the Practice of Statistics
Statistics
ISBN:
9781319013387
Author:
David S. Moore, George P. McCabe, Bruce A. Craig
Publisher:
W. H. Freeman