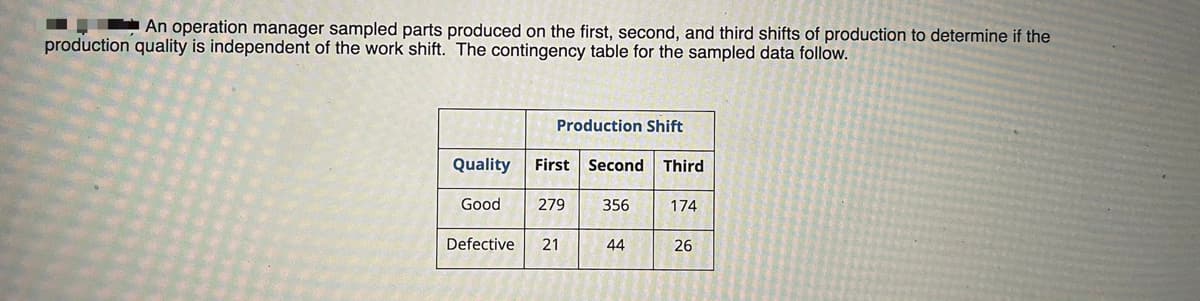
An operation manager sampled parts produced on the first, second, and third shifts of production to determine if the production quality is independent of the work shift. The contingency table for the sampled data follow. Production Shift Quality First Second Third Good 279 356 174 Defective 21 44 26


Inverse Normal Distribution
The method used for finding the corresponding z-critical value in a normal distribution using the known probability is said to be an inverse normal distribution. The inverse normal distribution is a continuous probability distribution with a family of two parameters.
Mean, Median, Mode
It is a descriptive summary of a data set. It can be defined by using some of the measures. The central tendencies do not provide information regarding individual data from the dataset. However, they give a summary of the data set. The central tendency or measure of central tendency is a central or typical value for a probability distribution.
Z-Scores
A z-score is a unit of measurement used in statistics to describe the position of a raw score in terms of its distance from the mean, measured with reference to standard deviation from the mean. Z-scores are useful in statistics because they allow comparison between two scores that belong to different normal distributions.


Trending now
This is a popular solution!

Step by step
Solved in 3 steps with 3 images

An operation manager sampled parts produced on the first, second, and third shifts of production to determine if the production quality is independent of the work shift. The contingency table for the sampled data follow.
|
|
Production Shift |
||
|
Quality |
First |
Second |
Third |
|
Good |
279 |
356 |
174 |
|
Defective |
21 |
44 |
26 |
- What is the estimated proportion of defective parts for third shift based on the sample data?
Enter your response in percent and round it to the nearest integer. Do not include the percent sign in your response.
Your answer is:
- Under the assumption that the production quality is independent of the work shift, what is the estimated frequency for defective parts in the third shift?
Enter your response in xx.xx format. Round your response to two decimals and use leading or trailing zeros to match the format exactly. For example, if your answer is 6.512, enter 06.51 and if your answer is 16.7 enter 16.70
Your answer is:
- Under the assumption that the production quality is independent of the work shift, what is the value of cell chi-square for defective parts in the third shift?
Enter your response in xx.xx format. Round your response to two decimals and use leading or trailing zeros to match the format exactly. For example, if your answer is 6.512, enter 06.51 and if your answer is 16.7 enter 16.70
Your answer is:
- Using 0.05 level of significance conduct a hypothesis test to determine if there is a relationship between the production quality and the production work shift during which the parts are produced.
- Which of the following(s) is (are) appropriate formulation for the alternative hypotheses in this problem?
In each case enter “Y” if the formulation is appropriate for the alternative hypothesis and enter “N” if it is not.
- Production quality is independent of the work shift. Your answer (Y/N) is :
- There is a no relationship between production quality and the work shift. Your answer (Y/N) is:
- Production quality is not independent of the work shift. Your answer (Y/N) is:
- What is the value of overall chi-square for this problem?
Enter your response in xx.xx format. Round your response to two decimals and use leading or trailing zeros to match the format exactly. For example, if your answer is 6.512, enter 06.51 and if your answer is 16.7 enter 16.70
Your answer is:
- What is the P-Value for this test?
Enter your response in 0.xxx format. Round your response to three decimals and use leading or trailing zeros to match the format exactly. For example, if your answer is 0.08554 enter 0.086 and if your answer is 0.8 then enter 0.800. If your answer is 0.81 then you must enter 0.810.
Your answer is:
- Which of the following(s) is (are) an appropriate conclusion for this test?
In each case enter “Y” if the conclusion is appropriate for this problem and enter “N” if it is not.
-
- At 0.05 level of significance, the data suggests that production quality is independent of the work shift. Your answer (Y/N) is :
- At 0.05 level of significance, the data suggests that there is no relationship between production quality and the work shift. Your answer (Y/N) is:
- At 0.10 level of significance, the data suggests that there is a relationship between production quality and the work shift. Your answer (Y/N) is:
- At 0.05 level of significance, there is not sufficient evidence to suggest that the production quality is not independent of the work shift. Your answer (Y/N) is:

