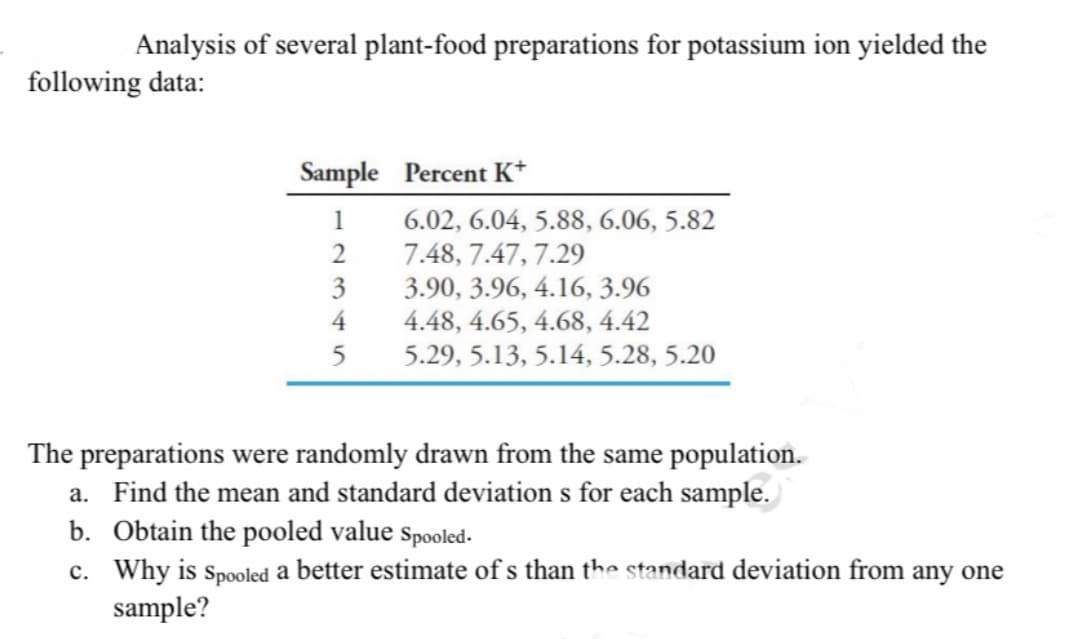
Analysis of several plant-food preparations for potassium ion yielded the following data: Sample Percent K* 1 6.02, 6.04, 5.88, 6.06, 5.82 7.48, 7.47, 7.29 3.90, 3.96, 4.16, 3.96 4.48, 4.65, 4.68, 4.42 5.29, 5.13, 5.14, 5.28, 5.20 2 3 45


Q: Listed below are duration times (seconds) and time intervals (min) to the next eruption for randomly…
A: The hypotheses are given below: Null hypothesis: H0: ρ= 0 Alternative hypothesis: Ha: ρ ≠ 0 Degrees…
Q: Suppose samples of soil around homes in an area were obtained and the lead level in each was…
A: Empirical rule: The Empirical Rule states that 99.7% of data observed following a normal…
Q: The following table shows the concentration of particulate matter (PM2.5) and wind velocity recorded…
A: The sample mean is computed by dividing the ratio of sum of the observation by the total number of…
Q: The following data are measures of pulmonary vascular resistance (PVR) in eight lambs before and…
A:
Q: A gym trainer claims that people who goes to the gym tend to eat more food after their first day of…
A: The claim of the gym trainer is that people who join the gym eat more food after the first day. To…
Q: Which of the following study designs is most efficient in studying a rare exposure? A. Case control…
A: Solution-: Which of the following study designs is most efficient in studying a rare exposure?(A)…
Q: Given the linear correlation coefficient r and the sample size n, determine the critical values of r…
A: The critical value is obtained below:From the given information the value of correlation is (r) =…
Q: The following data, based on the results of a study, in percentages of limestone in the soil…
A:
Q: In a test for significance of a Pearson correlation for a sample of n = 30 individuals, you…
A:
Q: Interpret the following statement regarding the statistical findings of a research study. “61% (n =…
A: Introduction: The outcome of a study involving low-carbohydrate and low-fat diets is given.
Q: All the following are measures of association except.... Select one or more: Da. range DD VARIANCE…
A:
Q: A paper gave summary quantities for blood lead level (in micrograms per deciliter) for a sample of…
A: Calculate the Sample mean using general formula.................................
Q: An experiment measuring the percent shrinkage on drying of a sample of 50 clay specimens produced…
A: Given data, The data is sorted in acending order as follows: 13.4 13.9 14.3 14.8 15.4 15.6 15.8…
Q: For the following studies, identify the population, sample, population parameter, and smaple…
A: The population can be defined as the cluster of all the individuals whose characteristics a…
Q: Air samples for worker's exposure to oil mist were found to indicate the followir levels in Table 1.…
A: Here data given for two samples. We have to calculate TWA. We know : TWA =…
Q: In the effect size formula, what does d stand for and what does m stand for? When considering a…
A: Effect size formula (Cohen’s D): One of the most common ways to measure effect size is Cohen’s D…
Q: Given the linear correlation coefficient r and the sample size n, determine the critical values of r…
A: DF = n-2 = 5-2 = 3 The critical values are -0.878 and 0.878. Decision Rule : Reject H0 if r is not…
Q: Prior to assessment of the outcome, the researchers did a manipulation check. Members of Groups 1…
A: It is given that the F-test statistic is 184.29, the degrees of freedom for first and second groups…
Q: Is the correlation significant at α=0.05? Use the table of critical values for R to decide Sample 27…
A: Solution-: Given: n=27,R=0.775 We check, Is the correlation significant at α=0.05?
Q: Using the data below, calculate the correlation of these samples. Round your answer to 1 decimal…
A: The provided data set is: seed mass seedling height 5.06 7.91 5.06 7.25 5.5…
Q: A paper gave summary quantities for blood lead level (in micrograms per deciliter) for a sample of…
A: Note: As per our company guidelines, we are supposed to answer only the first question. Kindly…
Q: Given the linear correlation coefficient r and the sample size n, determine the critical values of r…
A: H0: ρ = 0H1: ρ ≠ 0 ______________________
Q: Consider the following data on marks obtained in Quizzes 1 and 2 by a sample of 10 students enrolled…
A: Hi! Thank you for the question, As per the honor code, we are allowed to answer three sub-parts at a…
Q: Given the linear correlation coefficient r and the sample size n, determine the critical values of…
A: State the hypotheses. That is, there is no sufficient evidence to conclude that there is linear…
Q: Conduct a hypothesis test using an alpha level of α = .01 to determine if the correlation is…
A: Given that the correlation between Job satisfaction and work-life balance is given by r = 0.69…
Q: In a study conducted to examine the quality of fish after 7 days in ice storage, tên raw fish of the…
A: The correlation coefficient is a statistical measure of the strength of the relationship between the…
Q: Exposure to microbial products, especially endotoxin, may have an impact on vulnerability to…
A: Mean is calculate by adding all the observation in the sample divide by the sample size. It provide…
Q: The homogeneity of the chloride level in a water sample from a lake was tested by analyzing portions…
A: a)
Q: The following data are measures of pulmonary vascular resistance (PVR) in eight lambs before and…
A: As per our guidelines we can solve first three sub part of question and rest can be reposted.…
Q: If a researcher reports a t-statistic with df = 18, how many individual subjects participated in the…
A: Given: Df = 18
Q: using monthly data from January 1992 to December 2000, we estimate the following equation for…
A: Solution is given below
Q: Using the data below, calculate the correlation of these samples. Round your answer to 1 decimal…
A: There are two related samples which are seed_mass and seedling_height. The independent variable is…
Q: Exposure to microbial products, especially endotoxin, may have an impact on vulnerability to…
A:
Q: Use a 0.01 significance level to test the claim that the two samples of Yttrium concentrations (in…
A: Given : The level of significance is 0.01 and the steps to test the claim the two samples of…
Q: For the following scenario, choose the appropriate statistical test. SCENARIO: In a study about…
A: It is given that the We want to do a study about highway fuel consumption amounts and for that…
Q: A study was made on the amount of converted sugar in a certain process at various temperatures. The…
A:
Q: The following is a table of the average monthly temperature of Raleigh, North Carolina and a…
A: The table shows the average monthly temperature of Raleigh, North Carolina.
Q: An experiment was conducted to investigate the effects of the concentrations of sulfuric acid…
A:
Q: The table below summarizes baseline characteristics of patients participating in a clinical trial.…
A: A) Decision Rule: If p-value ≤ α, then reject the null hypothesis. If p-value > α, then do…
Q: A random sample of nine cities gave the following figures for annual per capita of cigarette…
A: Given information: Cigarette consumption(x) Death Rate per million 470 180 510 140 400 160…
Q: Given the linear correlation coefficient r and the sample size n, determine the critical values of r…
A: Correlation coefficient : Correlation coefficient is used to determine strength of the association…
Q: ocate the following percentile under the normal curve and find its corresponding t-value. Sketch and…
A: The objective is to locate the percentile and find the corresponding t-value. Percentile is the…
Q: Suppose samples of soil around homes in an area were obtained and the lead level in each was…
A:
Q: The respiratory disturbance index (RDI), which is the number of apneic and hypopneic episodes per…
A: State the hypotheses. That is, there is no evidence to conclude that the female patients suffer…
Q: Given the linear correlation coefficient r and the sample size n, determine the critical values of r…
A: Given that, r=0.831 and n=5 Using table, we can find critical value as follows, Degrees of…
Q: The following data represent the length of life in minutes, measured to the nearest tenth, of a…
A: Given data indicates a random sample of 50 black mosquitoes subjected to a new spray in a laboratory…
Q: Listed below are the lead concentrations in ug/g measured in different traditional medicines. Use a…
A: State the hypotheses. From the information, given that mean lead concentration for all such…
Q: Data was collected for a sample of organic snacks. The amount of sugar (in mg) in each snack is…
A: Given that In histogram Frequency is taking on y-axis and amount of sugar taking on x-axis
Q: Consider the following measurements of blood hemoglobin concentrations (in g/dL) from three human…
A: Given Information: population1 = [ 14.7 , 15.22, 15.28, 16.58, 15.10 ] population2 = [ 15.66,…
Q: Prior to assessment of the outcome, the researchers did a manipulation check. Members of Groups 1…
A: Q1)The calculate F-statistic = 184.29Critical f-value at df(1,108) = 3.929Excel formula used:…

Step by step
Solved in 2 steps with 1 images

- A researcher reports an F-ratio with dfbetween = 2 and dfwithin = 30 for an independent-measures ANOVA. a. How many treatment conditions were compared in the experiment? b. How many subjects participated ion the experiment?A researcher conducts a two-year study comparing the number of cavities in a group of 30 randomly selected young children from the community before and after the application of fluoride to test if there is a decrease in the number of cavities. This is an example of a/an: Independent-samples t test or Dependent-samples t test?For a certain experiment, the following values of fracture stress (in megapascals) presented below were measured for a sample of 24 mixtures of hot-mixed asphalt (HMA). Determine the median, the lower quartile, the upper quartile, and the 65th percentile of the measurements.
- Listed below are amounts of strontium-90 (in millibecquerels, or mBq, per gram of calcium) in a simple random sample by baby teeth obtained from Pennsylvania residents and New York residents born after 1979. Use a 0.05 significance level and Wilcoxon rank-sum test to test the claim that the median amount of strontium-90 from Pennsylvania residents is the same as the median from New York residents. Pennsylvania 155 142 149 130 151 163 151 142 156 133 138 161 New York 133 140 142 131 134 129 128 140 140 140 137 143 1. what is the exact value of R = R 1 (Pennsylvania)? (Round off to 1 decimal place.) 2. what is the value of μ R ? (Type as a whole number.) 3. what is the value of σ R ? (Round off to 2 decimal places.) 4. what is the computed value of z ? (Round off to 2 decimal places.) 5. what is the tabular value of z ? (Round off to 2 decimal places.Three samples of each of three types of PVC pipe of equal wall thickness are tested to failure under three temperature conditions, yielding the results shown below. Research questions: Is mean burst strength affected by temperature and/or by pipe type? Is there a “best” brand of PVC pipe? Burst Strength of PVC Pipes (psi) Temperature PVC1 PVC2 PVC3 Hot (70º C) 247 299 239 277 287 262 283 275 279 Warm (40º C) 325 341 297 322 319 315 296 335 304 Cool (10º C) 358 375 327 366 352 334 338 359 340 Click here for the Excel Data File (a-1) Choose the correct row-effect hypotheses. a. H0: A1 ≠ A2 ≠ A3 ≠ 0 ⇐⇐ Temperature means differ H1: All the Aj are equal to zero ⇐⇐ Temperature means are the same b. H0: A1 = A2 = A3 = 0 ⇐⇐ Temperature means are the same H1: Not all the Aj are equal to zero ⇐⇐ Temperature means differ a b (a-2) Choose the correct column-effect hypotheses. a. H0: B1 ≠ B2 ≠ B3 ≠ 0 ⇐⇐…A study of college students in the city of Pemblington found that 8% had been victims of violent crimes. a) statistics b) parameter
- The Goodman Tire and Rubber Company periodically tests its tires for tread wear under simulated road conditions. To study and control the manufacturing process, 20 samples, each containing three radial tires, were chosen from different shifts over several days of operation, with the following results. Tread wear measurements are in hundredths of an inch. Sample Tread Wear 1 31 42 28 2 26 18 35 3 25 30 34 4 17 25 21 5 38 29 35 6 41 42 36 7 21 17 29 8 32 26 28 9 41 34 33 10 29 17 30 11 26 31 40 12 23 19 25 13 17 24 32 14 43 35 17 15 18 25 29 16 30 42 31 17 28 36 32 18 40 29 31 19 18 29 28 20 22 34 26 Assuming that these data were collected when the manufacturing process was believed to be operating in control, develop the R chart. Compute the upper and lower control limits for the R chart. (Round your answers to two decimal places.) Assuming that these data were collected when the manufacturing process was believed to be operating in…Consider the following measurements of blood hemoglobin concentrations (in g/dL) from three human populations at different geographic locations: population1 = [ 14.7 , 15.22, 15.28, 16.58, 15.10 ] population2 = [ 15.66, 15.91, 14.41, 14.73, 15.09] population3 = [ 17.12, 16.42, 16.43, 17.33] If you run ANOVA on the data for the three populations, what is the range of the P-value? Greater than 0.05 between 0.05 and 0.025 between 0.025 and 0.01 less than 0.01A researcher conducted a repeated measures study comparing three treatment conditions. Refer to attached images and tale to answer a to d. Mean Std. Deviation N Treatment I 1.00 1.414 5 Treatment II 5.00 2.345 5 Treatment III 6.00 1.581 5 In APA format, report the F-ratio related to the treatment effect: Is this treatment effect significant? What is the partial η2 value for the treatment effect? Is this a weak, moderate, or strong effect?
- A researcher wanted to determine if carpeted rooms contain more bacteria than uncarpeted rooms. The table shows the results for the number of bacteria per cubic foot for both types of rooms. Full data set Carpeted Uncarpeted 7.5 14.9 9.4 5.1 10.6 4.2 9.2 12.7 9.9 13.3 9.3 4.2 6.9 11.1 7.5 12.5 Determine whether carpeted rooms have more bacteria than uncarpeted rooms at the α=0.05 level of significance. Normal probability plots indicate that the data are approximately normal and boxplots indicate that there are no outliers. State the null and alternative hypotheses. Let population 1 be carpeted rooms and population 2 be uncarpeted rooms. A. H0: μ1=μ2 H1: μ1>μ2 This is the correct answer. B. H0: μ1<μ2 H1: μ1>μ2 C. H0: μ1=μ2 H1: μ1≠μ2 D. H0: μ1=μ2 H1: μ1<μ2 Your answer is not correct. Determine the P-value for this hypothesis test. P-value=nothing…A paper gave summary quantities for blood lead level (in micrograms per deciliter) for a sample of whites and a sample of African Americans. Data consistent with the given summary quantities is given below. Whites (W) 8.3 0.9 2.9 5.6 5.8 5.4 1.2 1.0 1.4 2.1 1.3 5.3 8.4 6.6 5.2 3.4 2.9 2.7 6.7 3.6 African Americans (AA) 4.8 1.4 0.9 10.8 2.4 0.6 5.0 5.4 6.1 2.9 5.0 2.1 7.5 3.4 13.6 1.4 3.7 3.3 14.8 3.9 (a) Calculate the values of the mean and the median for blood lead level for the sample of African Americans. mean median (b) Which of the mean or the median is larger? What characteristic of the data set explains the relative values of the mean and the median? The median is greater than the mean. This is explained by the fact that the distribution is positively skewed. The mean is greater than the median. This is explained by the fact that the distribution is positively skewed. The median is greater than the mean. This is explained by the fact that the…To combat antibiotic resistance, the Quality Improvement Consortium recommends a throat swab to confirm strep throat before a physician prescribes antibiotics to children under age 5. Nationally, 40 percent of children under 5 who received antibiotics did not have a throat swab. The Colorado Department of Health took a random sample of 60 children under the age of 5 who received antibiotics for throat infections and found that 18 did not have a throat swab. At α = .05, is this a statistically significant reduction over last year’s national rate of 40 percent? (a-1) Calculate the critical value. (A negative value should be indicated by a minus sign. Round your answer to 3 decimal places.) Critical value _____ (a-2) Calculate the test statistic. (A negative value should be indicated by a minus sign. Round your answer to 2 decimal places.) Test statistic _____