The homogeneity of the chloride level in a water sample from a lake was tested by analyzing portions drawn from the top and from near the bottom of the lake, with the following results in ppm Cl: Тop Bottom 26.30 26.22 26.43 26.32 26.28 26.20
The homogeneity of the chloride level in a water sample from a lake was tested by analyzing portions drawn from the top and from near the bottom of the lake, with the following results in ppm Cl: Тop Bottom 26.30 26.22 26.43 26.32 26.28 26.20

MATLAB: An Introduction with Applications
6th Edition
ISBN:9781119256830
Author:Amos Gilat
Publisher:Amos Gilat
Chapter1: Starting With Matlab
Section: Chapter Questions
Problem 1P

Related questions
Question
100%
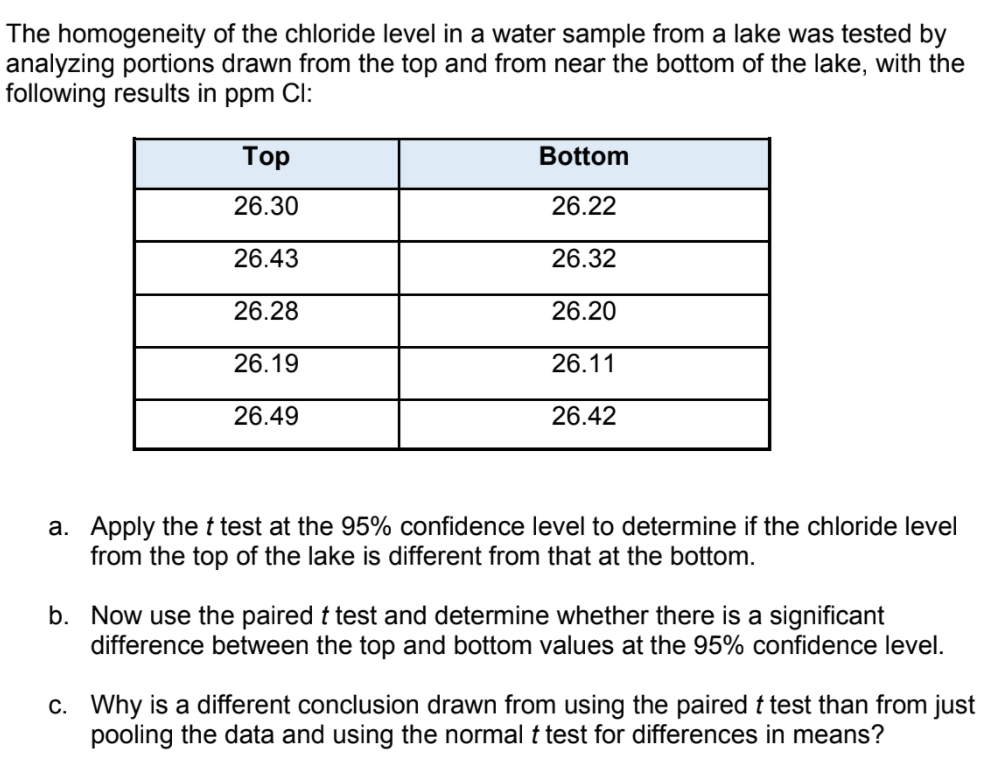
Transcribed Image Text:The homogeneity of the chloride level in a water sample from a lake was tested by
analyzing portions drawn from the top and from near the bottom of the lake, with the
following results in ppm Cl:
Тоp
Bottom
26.30
26.22
26.43
26.32
26.28
26.20
26.19
26.11
26.49
26.42
a. Apply the t test at the 95% confidence level to determine if the chloride level
from the top of the lake is different from that at the bottom.
b. Now use the paired t test and determine whether there is a significant
difference between the top and bottom values at the 95% confidence level.
c. Why is a different conclusion drawn from using the paired t test than from just
pooling the data and using the normal t test for differences in means?
Expert Solution
This question has been solved!
Explore an expertly crafted, step-by-step solution for a thorough understanding of key concepts.

This is a popular solution!

Trending now
This is a popular solution!

Step by step
Solved in 5 steps with 6 images

Recommended textbooks for you
MATLAB: An Introduction with Applications
Statistics
ISBN:
9781119256830
Author:
Amos Gilat
Publisher:
John Wiley & Sons Inc

Probability and Statistics for Engineering and th…
Statistics
ISBN:
9781305251809
Author:
Jay L. Devore
Publisher:
Cengage Learning

Statistics for The Behavioral Sciences (MindTap C…
Statistics
ISBN:
9781305504912
Author:
Frederick J Gravetter, Larry B. Wallnau
Publisher:
Cengage Learning
MATLAB: An Introduction with Applications
Statistics
ISBN:
9781119256830
Author:
Amos Gilat
Publisher:
John Wiley & Sons Inc
Probability and Statistics for Engineering and th…
Statistics
ISBN:
9781305251809
Author:
Jay L. Devore
Publisher:
Cengage Learning
Statistics for The Behavioral Sciences (MindTap C…
Statistics
ISBN:
9781305504912
Author:
Frederick J Gravetter, Larry B. Wallnau
Publisher:
Cengage Learning

Elementary Statistics: Picturing the World (7th E…
Statistics
ISBN:
9780134683416
Author:
Ron Larson, Betsy Farber
Publisher:
PEARSON

The Basic Practice of Statistics
Statistics
ISBN:
9781319042578
Author:
David S. Moore, William I. Notz, Michael A. Fligner
Publisher:
W. H. Freeman

Introduction to the Practice of Statistics
Statistics
ISBN:
9781319013387
Author:
David S. Moore, George P. McCabe, Bruce A. Craig
Publisher:
W. H. Freeman