Analysis produced the following results: Total Sum of Squares 4633 Unexplained Sum of Squares 2010 What percentage of the variation in the dependent variable has been explained by variation in the independent variable?
Analysis produced the following results: Total Sum of Squares 4633 Unexplained Sum of Squares 2010 What percentage of the variation in the dependent variable has been explained by variation in the independent variable?

Glencoe Algebra 1, Student Edition, 9780079039897, 0079039898, 2018
18th Edition
ISBN:9780079039897
Author:Carter
Publisher:Carter
Chapter10: Statistics
Section10.6: Summarizing Categorical Data
Problem 4BGP

Related questions
Question
Analysis produced the following results:
Total Sum of Squares 4633
Unexplained Sum of Squares 2010
What percentage of the variation in the dependent variable has been explained by variation in the independent variable?
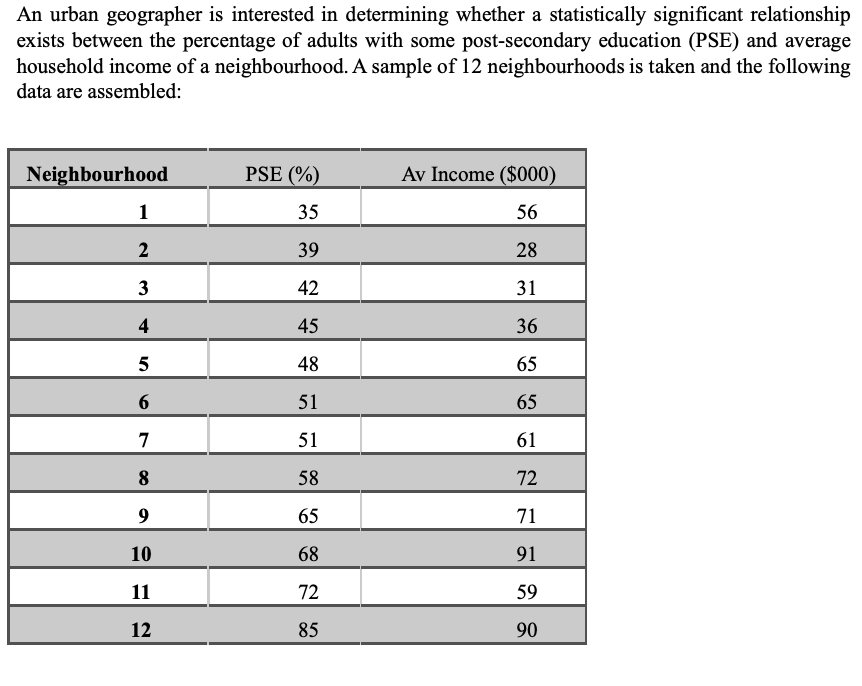
Transcribed Image Text:An urban geographer is interested in determining whether a statistically significant relationship
exists between the percentage of adults with some post-secondary education (PSE) and average
household income of a neighbourhood. A sample of 12 neighbourhoods is taken and the following
data are assembled:
Neighbourhood
PSE (%)
Av Income ($000)
1
35
56
2
39
28
3
42
31
45
36
48
65
6
51
65
7
51
61
8
58
72
9
65
71
10
68
91
11
72
59
12
85
90
4-
Expert Solution
This question has been solved!
Explore an expertly crafted, step-by-step solution for a thorough understanding of key concepts.

Step by step
Solved in 2 steps with 1 images

Recommended textbooks for you
Glencoe Algebra 1, Student Edition, 9780079039897…
Algebra
ISBN:
9780079039897
Author:
Carter
Publisher:
McGraw Hill
Glencoe Algebra 1, Student Edition, 9780079039897…
Algebra
ISBN:
9780079039897
Author:
Carter
Publisher:
McGraw Hill