Benign prostatic hyperplasia is a noncancerous enlargement of the prostate gland that adversely affects the quality of life (QoL) of millions of men. A study of minimally invasive procedures for the treatment for this condition looked at pretreatment QoL (qol_base) and quality of life after 3 month on treatment (qol_3mo) The baseline data for 10 patients and their 3 month follow-up data is presented below: MAXFLO_B = maximum urine flow at baseline (urine flow measurement scale misplaced) MAXFLO3M = maximum urine flow after 3 months of treatment maxflo_b maxflo3m 7 8 18
Benign prostatic hyperplasia is a noncancerous enlargement of the prostate gland that adversely affects the quality of life (QoL) of millions of men. A study of minimally invasive procedures for the treatment for this condition looked at pretreatment QoL (qol_base) and quality of life after 3 month on treatment (qol_3mo) The baseline data for 10 patients and their 3 month follow-up data is presented below: MAXFLO_B = maximum urine flow at baseline (urine flow measurement scale misplaced) MAXFLO3M = maximum urine flow after 3 months of treatment maxflo_b maxflo3m 7 8 18

MATLAB: An Introduction with Applications
6th Edition
ISBN:9781119256830
Author:Amos Gilat
Publisher:Amos Gilat
Chapter1: Starting With Matlab
Section: Chapter Questions
Problem 1P

Related questions
Question
100%
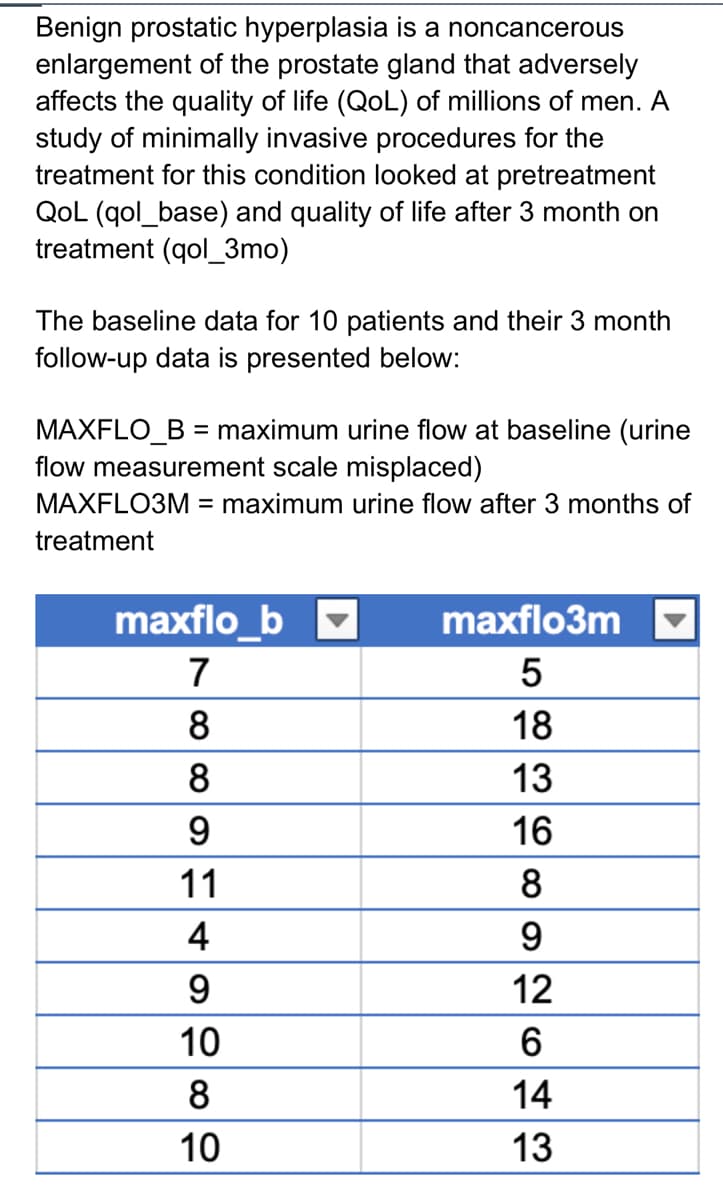
Transcribed Image Text:Benign prostatic hyperplasia is a noncancerous
enlargement of the prostate gland that adversely
affects the quality of life (QoL) of millions of men. A
study of minimally invasive procedures for the
treatment for this condition looked at pretreatment
QoL (qol_base) and quality of life after 3 month on
treatment (qol_3mo)
The baseline data for 10 patients and their 3 month
follow-up data is presented below:
MAXFLO_B = maximum urine flow at baseline (urine
flow measurement scale misplaced)
MAXFLO3M = maximum urine flow after 3 months of
treatment
maxflo_b
maxflo3m
7
5
8
18
8
13
9
16
11
8
4
9
12
10
6
8
14
10
13
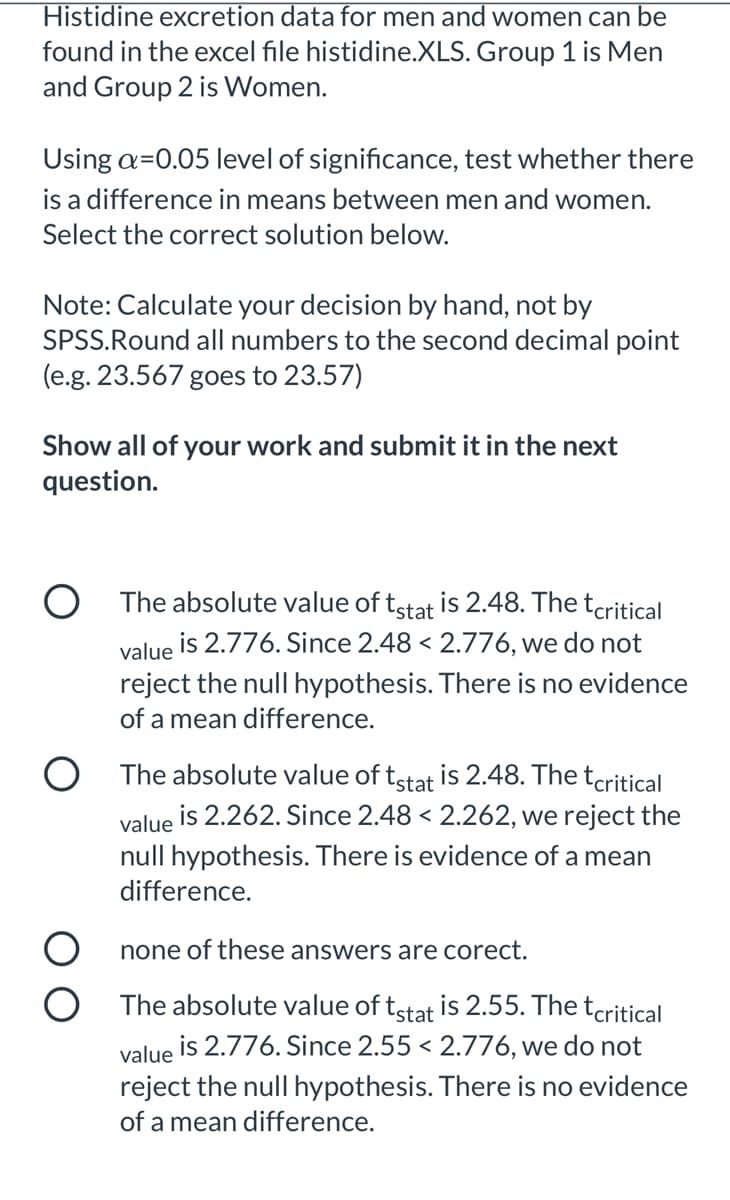
Transcribed Image Text:Histidine excretion data for men and women can be
found in the excel file histidine.XLS. Group 1 is Men
and Group 2 is Women.
Using a=0.05 level of significance, test whether there
is a difference in means between men and women.
Select the correct solution below.
Note: Calculate your decision by hand, not by
SPSS.Round all numbers to the second decimal point
(e.g. 23.567 goes to 23.57)
Show all of your work and submit it in the next
question.
O The absolute value of tstat is 2.48. The tcritical
value is 2.776. Since 2.48 < 2.776, we do not
reject the null hypothesis. There is no evidence
of a mean difference.
is 2.48. The tcritical
O The absolute value of tstat
is 2.262. Since 2.48 < 2.262, we reject the
value
null hypothesis. There is evidence of a mean
difference.
none of these answers are corect.
The absolute value of tstat is 2.55. The tcritical
is 2.776. Since 2.55 < 2.776, we do not
value
reject the null hypothesis. There is no evidence
of a mean difference.
Expert Solution
This question has been solved!
Explore an expertly crafted, step-by-step solution for a thorough understanding of key concepts.

This is a popular solution!

Trending now
This is a popular solution!

Step by step
Solved in 2 steps with 2 images

Recommended textbooks for you
MATLAB: An Introduction with Applications
Statistics
ISBN:
9781119256830
Author:
Amos Gilat
Publisher:
John Wiley & Sons Inc

Probability and Statistics for Engineering and th…
Statistics
ISBN:
9781305251809
Author:
Jay L. Devore
Publisher:
Cengage Learning

Statistics for The Behavioral Sciences (MindTap C…
Statistics
ISBN:
9781305504912
Author:
Frederick J Gravetter, Larry B. Wallnau
Publisher:
Cengage Learning
MATLAB: An Introduction with Applications
Statistics
ISBN:
9781119256830
Author:
Amos Gilat
Publisher:
John Wiley & Sons Inc
Probability and Statistics for Engineering and th…
Statistics
ISBN:
9781305251809
Author:
Jay L. Devore
Publisher:
Cengage Learning
Statistics for The Behavioral Sciences (MindTap C…
Statistics
ISBN:
9781305504912
Author:
Frederick J Gravetter, Larry B. Wallnau
Publisher:
Cengage Learning

Elementary Statistics: Picturing the World (7th E…
Statistics
ISBN:
9780134683416
Author:
Ron Larson, Betsy Farber
Publisher:
PEARSON

The Basic Practice of Statistics
Statistics
ISBN:
9781319042578
Author:
David S. Moore, William I. Notz, Michael A. Fligner
Publisher:
W. H. Freeman

Introduction to the Practice of Statistics
Statistics
ISBN:
9781319013387
Author:
David S. Moore, George P. McCabe, Bruce A. Craig
Publisher:
W. H. Freeman