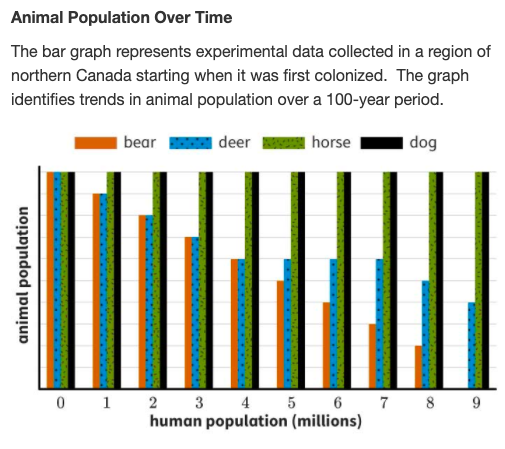
Animal Population Over Time The bar graph represents experimental data collected in a region of northern Canada starting when it was first colonized. The graph identifies trends in animal population over a 100-year period. bear deer horse dog 0 1 2 3 4 5 6 7 8 9 human population (millions) animal population
Animal Population Over Time The bar graph represents experimental data collected in a region of northern Canada starting when it was first colonized. The graph identifies trends in animal population over a 100-year period. bear deer horse dog 0 1 2 3 4 5 6 7 8 9 human population (millions) animal population

Biology (MindTap Course List)
11th Edition
ISBN:9781337392938
Author:Eldra Solomon, Charles Martin, Diana W. Martin, Linda R. Berg
Publisher:Eldra Solomon, Charles Martin, Diana W. Martin, Linda R. Berg
Chapter53: Introduction To Ecology: Population Ecology
Section: Chapter Questions
Problem 17TYU

Related questions
Question
Use the passage to answer the question.
Provide a hypothesis that explains the reduction over time of certain animal populations and not others
Identify which factors explain the presence of the animal populations that are present in the community.
Transcribed Image Text:Animal Population Over Time
The bar graph represents experimental data collected in a region of
northern Canada starting when it was first colonized. The graph
identifies trends in animal population over a 100-year period.
| bear
deer
horse
| dog
0 1 2 3 4 5 6 7 8 9
human population (millions)
animal population
Expert Solution
This question has been solved!
Explore an expertly crafted, step-by-step solution for a thorough understanding of key concepts.

This is a popular solution!

Trending now
This is a popular solution!

Step by step
Solved in 2 steps

Knowledge Booster


Learn more about
Need a deep-dive on the concept behind this application? Look no further. Learn more about this topic, biology and related others by exploring similar questions and additional content below.Recommended textbooks for you
Biology (MindTap Course List)
Biology
ISBN:
9781337392938
Author:
Eldra Solomon, Charles Martin, Diana W. Martin, Linda R. Berg
Publisher:
Cengage Learning

Biology (MindTap Course List)
Biology
ISBN:
9781337392938
Author:
Eldra Solomon, Charles Martin, Diana W. Martin, Linda R. Berg
Publisher:
Cengage Learning