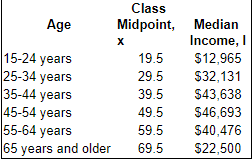
An individual's income varies with age. The table shows the median income I of individuals of different age groups within the United States for a certain year. For each age group, let the class midpoint represent the independent variable x. For the class "65 years and older," assume that the class midpoint is 69.5. Complete parts (a) through (e). (a) Use a graphing utility to draw a scatter diagram of the data. Comment on the type of relation that may exist between the two variables. Which type of relation exists between the two variables? (b) Use a graphing utility to find the quadratic function of best fit that models the relation between age and median income. The quadratic function of best fit is y=___x2+_____x−____. (c) Use the function found in part (b) to determine the age at which an individual can expect to earn the most income.


Correlation
Correlation defines a relationship between two independent variables. It tells the degree to which variables move in relation to each other. When two sets of data are related to each other, there is a correlation between them.
Linear Correlation
A correlation is used to determine the relationships between numerical and categorical variables. In other words, it is an indicator of how things are connected to one another. The correlation analysis is the study of how variables are related.
Regression Analysis
Regression analysis is a statistical method in which it estimates the relationship between a dependent variable and one or more independent variable. In simple terms dependent variable is called as outcome variable and independent variable is called as predictors. Regression analysis is one of the methods to find the trends in data. The independent variable used in Regression analysis is named Predictor variable. It offers data of an associated dependent variable regarding a particular outcome.


Trending now
This is a popular solution!

Step by step
Solved in 3 steps with 4 images


