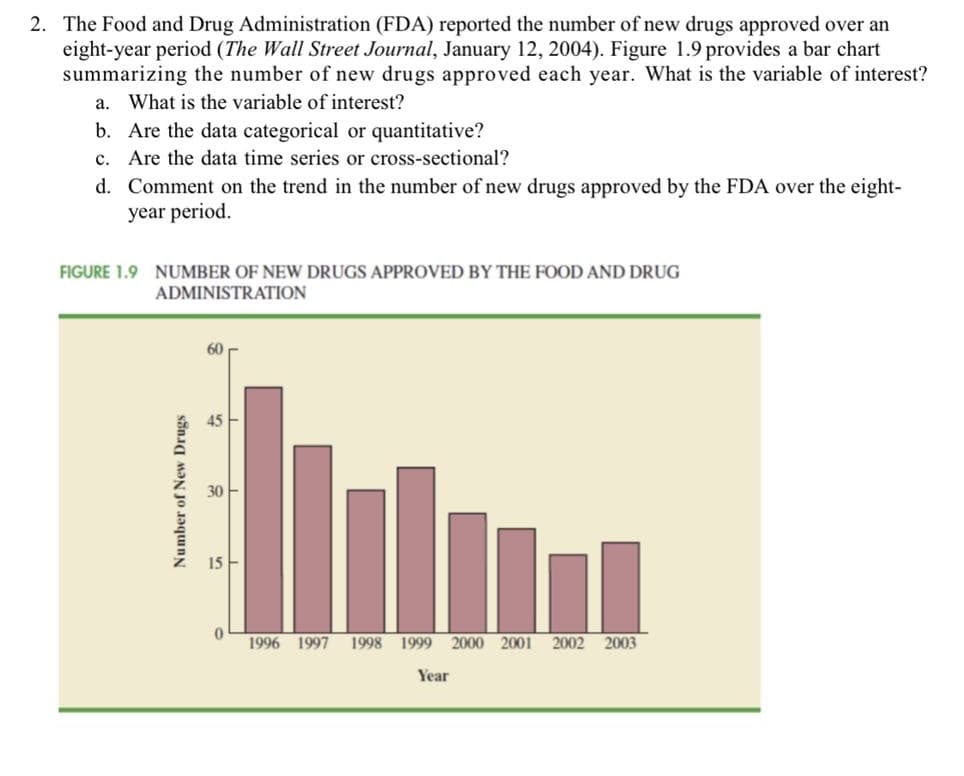
. The Food and Drug Administration (FDA) reported the number of new drugs approved over an eight-year period (The Wall Street Journal, January 12, 2004). Figure 1.9 provides a bar chart summarizing the number of new drugs approved each year. What is the variable of interes a. What is the variable of interest? b. Are the data categorical or quantitative? c. Are the data time series or cross-sectional? d. Comment on the trend in the number of new drugs approved by the FDA over the eight- year period. FIGURE 1.9 NUMBER OF NEW DRUGS APPROVED BY THE FOOD AND DRUG ADMINISTRATION 30 15 1996 1997 1998 1999 2000 2001 2002 2003 Year Number of New Drugs


Unitary Method
The word “unitary” comes from the word “unit”, which means a single and complete entity. In this method, we find the value of a unit product from the given number of products, and then we solve for the other number of products.
Speed, Time, and Distance
Imagine you and 3 of your friends are planning to go to the playground at 6 in the evening. Your house is one mile away from the playground and one of your friends named Jim must start at 5 pm to reach the playground by walk. The other two friends are 3 miles away.
Profit and Loss
The amount earned or lost on the sale of one or more items is referred to as the profit or loss on that item.
Units and Measurements
Measurements and comparisons are the foundation of science and engineering. We, therefore, need rules that tell us how things are measured and compared. For these measurements and comparisons, we perform certain experiments, and we will need the experiments to set up the devices.


Trending now
This is a popular solution!

Step by step
Solved in 3 steps


