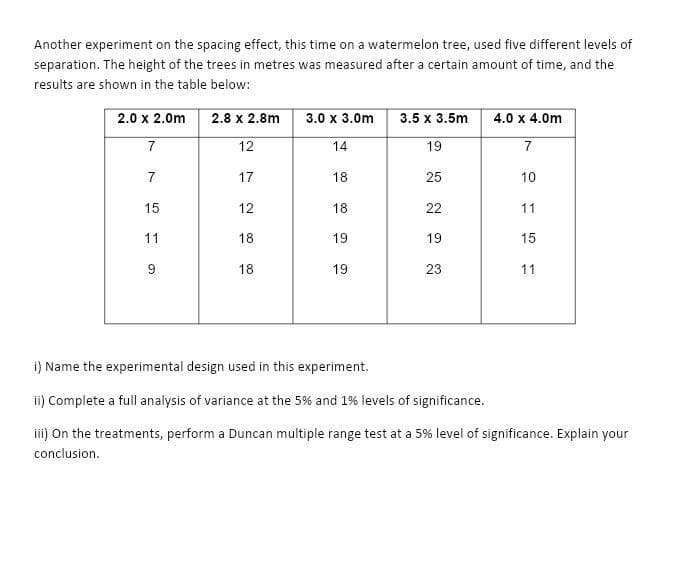
Another experiment on the spacing effect, this time on a watermelon tree, used five different levels of separation. The height of the trees in metres was measured after a certain amount of time, and the results are shown in the table below: 2.0 x 2.0m 2.8 x 2.8m 3.0 x 3.0m 3.5 x 3.5m 4.0 x 4.0m 7 12 14 19 7 7 17 18 25 10 15 12 18 22 11 11 18 19 19 15 9 18 19 23 11 i) Name the experimental design used in this experiment. ii) Complete a full analysis of variance at the 5% and 1% levels of significance. iii) On the treatments, perform a Duncan multiple range test at a 5% level of significance. Explain your conclusion.
Q: A researcher wishes to estimate the proportion of adults who have high speed internet access. What…
A: It is given that margin of error (E) is 0.03 and the confidence level is 0.90.
Q: What is the difference between an observational study and an experiment? C Choose the correct answer…
A: Given problem Given that What is the difference between an observational study and an experiment…
Q: The results of a study showed that heterosexual women, during ovulation, were significantly better…
A: Given Population proportion=0.67 n=100
Q: The following data show the brand, price (S), and the overall score for six stereo headphones that…
A: Solution: Given information: The estimated regression equation is y^=23.2437+0.3176x
Q: Suppose that the amount of time that students spend studying in the library in one sitting is…
A:
Q: An economist at the Florida Department of Labor and Employment needs to estimate the unemployment…
A: An economist at the Florida Department of Labor and Employment needs to estimate the unemployment…
Q: A particular fruit's weights are normally distributed, with a mean of 583 grams and a standard…
A: To find: The heaviest 15% of fruits weigh more than how many grams?
Q: A normal resting heart rate for adults ranges from about 60 to 100 beats per minute (BPM). A doctor…
A: Solution-: We want to find (a) The point estimate (b) Sample standard deviation (c) Margin of error…
Q: Assuming that the heights of college women are normally distributed with mean 68 inches and standard…
A: Given Mean=68 Standard deviation=3
Q: A random sample of 100 observations from a population with standard deviation 32 yielded a sample…
A:
Q: (b) Estimate the percentage of bills for which payment was made in less than 20 days. Approximately…
A: Z value is known as standard normal value. It explain the number of observations deviated from the…
Q: The lengths and weights of a zoo's pygmy shrews were recorded during their annual health check.…
A: The regression equation is given by y = a + bX
Q: According to a recent study, the carapace length for adult males of a certain species of tarantula…
A: It is given that the mean is 17.44 and the standard deviation is 1.72.
Q: A population has standard deviation a-17.4. Part 1 of 2 (a) How large a sample must be drawn so that…
A: Given that Margin of error =E =3.3 Population standard deviation =17.4 99.8%
Q: f I conclude that as temperature increases, the number of snowboard sales decrease, this would be a…
A: The statement is As temperature increases, the number of snowboard sales decrease
Q: What is the probability that 8 out of 12 customers will see dramatic results? What is the…
A:
Q: An apple producer sells their product in bags that each contain 16 apples. These apples have a mean…
A: Hello. Since your question has multiple, we will solve first question for you. If you want remaining…
Q: The two main branches of statistics are qualitative statistics and quantitative statistics. sample…
A: Statistics: Statistics is a branch of science dealing with the collection, analysis, interpretation…
Q: An important application of regression analysis in accounting is in the estimation of cost. By…
A: Since you have posted question with multiple sub-parts, we will solve first 3 sub-parts for you. To…
Q: We wish to estimate what percent of adult residents in a certain county are parents. Out of 300…
A:
Q: Obtaining significant interactions guarantees that ALL of the main effects will statistically…
A: In the given problem, we have to answer in true or false of obtaining significant interactions…
Q: The table below shows a relative-frequency distribution for the heights of female students at a…
A: Relative Frequency Relative frequency is defined as the number of instances of a specific task…
Q: The U.S. Department of Energy reported that 51.7% of homes were heated by natural gas. A random…
A: Given X=115 n=221
Q: The lengths and weights of a zoo's pygmy shrews were recorded during their annual health check.…
A:
Q: How is a sample related to a population? Choose the correct answer below. OA. A sample is a subset…
A:
Q: An educator estimates that the dropout rate for seniors at high schools in a certain state is 15%.…
A: According to the given information in this question There are two different questions according to…
Q: Events A and B are mutually exclusive with P (A) equal to 0.331 and P (A or B) equal to 0.727. Find…
A:
Q: The mean salary of federal government employees on the General Schedule is $59,593. The average…
A: Assume that μ is the population average salary federal government employees on the General Schedule.
Q: Pinworm infestation, commonly found in children, can be treated with a drug that is effective in 92%…
A: Supposing a success s is that the child is cured, the success probability p is 0.92 P(Success) =…
Q: Let x = red blood cell (RBC) count in millions per cubic millimeter of whole blood. For healthy…
A: Hello. Since your question has multiple parts, we will solve first 3sub parts question for you. If…
Q: 2. Solve for the value of n given that the total population is 1650 and the percentage of error is…
A: HERE AS PER GUIDELINES I HAVE CALCULATED 3 SUBPARTS Here use slovin's formula
Q: A correlation of r = – 0.95 is stronger than r = + 0.70.
A: Given that correlation r=-0.95 and r=0.70
Q: A marketing expert for a pasta-making company believes that 40% of pasta lovers prefer lasagna. If…
A:
Q: Suppose a random sample of 1012 athletes from the college are asked what their major is. The table…
A: Given data: Total count = 1012 To fill the expected frequency
Q: Qualifying Test Scores To qualify for a medical study, an applicant must have a systolic blood…
A: From the given information we find the upper nd Lower limit.
Q: population of parameter A. 1. Find a 90% confidence interval for X;
A:
Q: Suppose that the amount of time that students spend studying in the library in one sitting is…
A: "Since you have posted a question with multiple sub-parts, we will solve the first three subparts…
Q: For number 13, refer to the graph below: What section performed twice as better as the other…
A:
Q: A large number of examples on Testing of Null hypothesis for large and small samples are given below…
A:
Q: A manufacturer knows that their items have a normally distributed lifespan, with a mean of 14.8…
A: Given,Mean(μ)=14.8standard deviation(σ)=2.5
Q: In a recent poll, 390 people were asked if they liked dogs, and 33% said they did. Find the Margin…
A: Given p^=Sample proportion=0.33 n=sample size=390 Confidence interval = 99%
Q: 1. The diameter of a ball bearing was measured by 12 inspectors, each using two different kinds of…
A: 1) The objective is to test if there is a significant difference between the means of the population…
Q: Below is a graph of a normal distribution with mean μ = -3 and standard deviation o=3. The shaded…
A:
Q: Full-time Ph.D. students receive an average of $12,837 per year. If the average salaries are…
A: Given that ; μ = $ 12837 ? = $ 1500 X = $ 17000 To find P( x < 17000) = ? ? P( x > 17000) =…
Q: Favorite Season Display the data to the right in a Pareto chart. Describe the difference in how the…
A: Solution: a. Since pareto chart shows season from highest to lowest frequency:
Q: 3. Treena and Maggie both wrote a provincial exam in mathematics. Treena wrote in January, and…
A:
Q: B A This graph has an r of -0.5. с D
A: Since you have asked multiple questions, we will solve the first question for you. If you want any…
Q: A marketing firm is considering making up to three new hires. Given its specific needs, the…
A: The following information has been given: Let X be a random variable represents the number of…
Q: What is Standard Error, and what does it mean?
A: Standard error : It is the estimated standard deviation or the measure of variability in the…
Q: A local non-profit group would like to estimate the proportion of residents of Martin county who do…
A:
Please help me.
Step by step
Solved in 4 steps
- In forestry, the diameter of a tree at breast height is used to model the height of the tree. Silviculturists working in British Columbia’s boreal forest conducted a series of spacing trials to predict the heights of several species of trees. The data are the breast height diameters (in centimeters) and heights (in meters) for a sample of 18 white spruce trees. B1 B2 18.9 20.0 15.5 16.8 19.4 20.2 20.0 20.0 29.8 20.2 19.8 18.0 20.3 17.8 20.0 19.2 22.0 22.3 16.6 18.8 15.5 16.9 13.7 16.3 27.5 21.4 20.3 19.2 22.9 19.8 14.1 18.5 10.1 12.1 5.8 8.0 B1: Breast Height Diameter of White spruce (cm) B2: Height (m) a) Plot the relationship using scatter diagram between the breast height diameters and the trees’ height. Are the breast height diameters and the trees’ height linearly related? What can you infer about the relationship between the two variables? Is a linear model appropriate? b) Compare the scatter plot in (a) with the correlation coefficient…For a two-factor ANOVA, if SSwithin treatments = 86, SSbetween treatments = 80, SSbetween subjects = 62, dfwithin treatments = 12, dfbetween treatments = 1, and dfbetween subjects = 4, find the F-ratio.A researcher collects data that represents the average number of hours of sleep in the last two nights by 8 depressed patients and 9 non-depressed patients. The researcher is interested in whether the two groups reliably differ in the amount of sleep they get. Use Jamovi to calculate t-obt and the p value.
- for the following table, find first skewness coefficient.A recent poll found that 664 out of 1026 randomly selected people in a particular country felt that colleges and universities with big sports programs placed too much emphasis on athletics over academics. Assuming the conditions for the CLT are met, use the accompanying Minitab output to complete parts a and b below. N Event Sample p 95% CI for p 1026 664 0.647173 (0.617934, 0.676413) Question content area bottom b. Suppose a sports blogger wrote an article claiming that a majority of adults from this country believe that colleges and universities with big sports programs place too much emphasis on athletics over academics. Does this confidence interval support the blogger's claim? Explain your reasoning. A. No, it is not a plausible claim because the confidence interval contains 50%. B. No, it is not a plausible claim because the confidence interval does not contain only values above 50%. C. Yes, it is a…For a population with u=90 and o=20, a score of x=105 would correspond to a z-score of
- A student decides to spin a dime and determine the proportion of times it lands on heads. The student spins the dime 25 times and records that it lands on heads 17 times. Let p = the true proportion of times the dime would land on heads when spun. Under the assumption that the true proportion is 0.5, 100 simulated proportions for samples of size 25 is shown in the dotplot. Using the dotplot, is there evidence that the proportion of times a spun dime lands on heads is greater than 0.5? A) Yes, a proportion of 0.68 proves that the true proportion of heads is greater than 0.5. B) Yes, a proportion of 0.68 only occurred once out of 100 simulated proportions; therefore, there is sufficient evidence that the true proportion of heads is greater than 0.5. C) No, a proportion of 0.68 is only 0.18 more than 0.5; therefore, there is insufficient evidence that the true proportion of heads is greater than 0.5. D) No, a proportion of 0.68 or more occurred 7 times out of 100 simulated…An agent for a property management company would like to be able to predict the monthly rental cost for apartments based on the size of the apartment as defined by square footage. A sample of the rent of 25 apartments in a college rental neighborhood was selected, and the information collected revealed the following: Apartment Size (Sq. Ft.) Monthly Rent ($) 1 850 950 2 1,450 1,600 3 1,085 1,200 4 1,232 1,500 5 718 950 6 1,485 1,700 7 1,136 1,650 8 726 935 9 700 875 10 956 1,150 11 1,100 1,400 12 1,285 1,650 13 1,985 2,300 14 1,369 1,800 15 1,175 1,400 16 1,225 1,450 17 1,245 1,100 18 1,259 1,700 19 1,150 1,200 20 896 1,150 21 1,361 1,600 22 1,040 1,650 23 755 1,200 24 1,000 800 25 1,200 1,750 e) Determine the coefficient of determination r2 and then completely interpret…An agent for a property management company would like to be able to predict the monthly rental cost for apartments based on the size of the apartment as defined by square footage. A sample of the rent of 25 apartments in a college rental neighborhood was selected, and the information collected revealed the following: Apartment Size (Sq. Ft.) Monthly Rent ($) 1 850 950 2 1,450 1,600 3 1,085 1,200 4 1,232 1,500 5 718 950 6 1,485 1,700 7 1,136 1,650 8 726 935 9 700 875 10 956 1,150 11 1,100 1,400 12 1,285 1,650 13 1,985 2,300 14 1,369 1,800 15 1,175 1,400 16 1,225 1,450 17 1,245 1,100 18 1,259 1,700 19 1,150 1,200 20 896 1,150 21 1,361 1,600 22 1,040 1,650 23 755 1,200 24 1,000 800 25 1,200 1,750 i) Determine a 95% interval estimate for the average rent of apartments with 1000…
- A glass manufacturing company wanted to investigate the effect of breakoff pressure and stopper height on the percentage of breaking off chips. The results are in the accompanying table. Complete parts (a) through (e). a. At the 0.01 level of significance is there an interaction between the breakoff pressure and the stopper height? b. is there an effect due to the breakoff pressure? c. is there an effect due to the stopper height? d. Plot the percentage breakoff for each breakoff pressure for each stopper height. e. Discuss the results of (a) through (d).The following data represent the results of a repeated-measures study comparing different viewing distances for a 42-inch-high-definition television. Four viewing distances were evaluated, 9 feet, 12 feet, 15 feet, and 18 feet. Each participant was free to move back and forth among the four distances while watching a 30-minute video on the television. The only restriction was that each person had to spend at least 2 minutes watching from each of the four distances. At the end of the video, each participant rated the all off of the viewing distances on a scale from 1 (very bad, definitely need to move closer or father way) to 7 (excellent, perfect viewing distance). Use a repeated-measures ANOVA with alpha = 0.05 to determine whether there is significant difference among the four viewing distances.Strack, Martin, and Stepper (1988) reported that people rate cartoons as funnier when holding a pen in their teeth (which forced them to smile) than when holding a pen in their lips (which forced them to frown). A researcher attempted to replicate this result using a sample of n = 25 adults between the ages 40 and 45. For each person, the researcher recorded the difference between the rating obtained while smiling and the rating obtained by frowning. On average, the cartoons were rated funnier when the participants were smiling, with an average difference of M D = 1.6 with SS = 150. In this problem, you do not have to calculate SS or the mean difference which is already provided. Will there be a difference between the two conditions? Use a two-tailed test with α = .01 Show all the steps. Problem solving template Compute test statistic (Repeated measure t-score) Variance for D scores: S2 Estimated standard error SMD :…