ANSWER 1-5 IF TRUE OR FALSE 1. As an initial attempt, we use multiple line chart to see trend and cycle 2. Seasonal adjusted is one of the components of time series to be decomposed. 3. In the irregularity (Error) component, special events or activities are manifested. One can also observe controlled volatility during periods where government made interventions on the series as a sign of good governance.
ANSWER 1-5 IF TRUE OR FALSE 1. As an initial attempt, we use multiple line chart to see trend and cycle 2. Seasonal adjusted is one of the components of time series to be decomposed. 3. In the irregularity (Error) component, special events or activities are manifested. One can also observe controlled volatility during periods where government made interventions on the series as a sign of good governance.

Chapter1: Making Economics Decisions
Section: Chapter Questions
Problem 1QTC

Related questions
Question
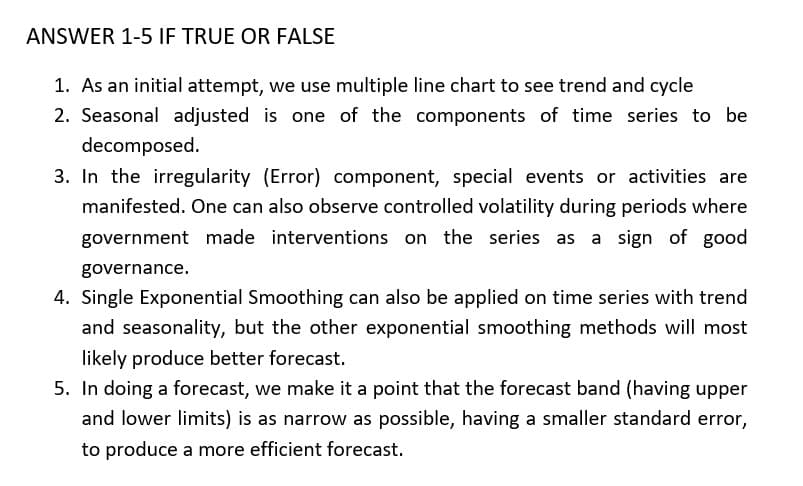
Transcribed Image Text:ANSWER 1-5 IF TRUE OR FALSE
1. As an initial attempt, we use multiple line chart to see trend and cycle
2. Seasonal adjusted is one of the components of time series to be
decomposed.
3. In the irregularity (Error) component, special events or activities are
manifested. One can also observe controlled volatility during periods where
government made interventions on the series as a sign of good
governance.
4. Single Exponential Smoothing can also be applied on time series with trend
and seasonality, but the other exponential smoothing methods will most
likely produce better forecast.
5. In doing a forecast, we make it a point that the forecast band (having upper
and lower limits) is as narrow as possible, having a smaller standard error,
to produce a more efficient forecast.
Expert Solution
This question has been solved!
Explore an expertly crafted, step-by-step solution for a thorough understanding of key concepts.

Step by step
Solved in 2 steps

Knowledge Booster


Learn more about
Need a deep-dive on the concept behind this application? Look no further. Learn more about this topic, economics and related others by exploring similar questions and additional content below.Recommended textbooks for you

Principles of Economics (12th Edition)
Economics
ISBN:
9780134078779
Author:
Karl E. Case, Ray C. Fair, Sharon E. Oster
Publisher:
PEARSON

Engineering Economy (17th Edition)
Economics
ISBN:
9780134870069
Author:
William G. Sullivan, Elin M. Wicks, C. Patrick Koelling
Publisher:
PEARSON
Principles of Economics (12th Edition)
Economics
ISBN:
9780134078779
Author:
Karl E. Case, Ray C. Fair, Sharon E. Oster
Publisher:
PEARSON
Engineering Economy (17th Edition)
Economics
ISBN:
9780134870069
Author:
William G. Sullivan, Elin M. Wicks, C. Patrick Koelling
Publisher:
PEARSON

Principles of Economics (MindTap Course List)
Economics
ISBN:
9781305585126
Author:
N. Gregory Mankiw
Publisher:
Cengage Learning

Managerial Economics: A Problem Solving Approach
Economics
ISBN:
9781337106665
Author:
Luke M. Froeb, Brian T. McCann, Michael R. Ward, Mike Shor
Publisher:
Cengage Learning

Managerial Economics & Business Strategy (Mcgraw-…
Economics
ISBN:
9781259290619
Author:
Michael Baye, Jeff Prince
Publisher:
McGraw-Hill Education