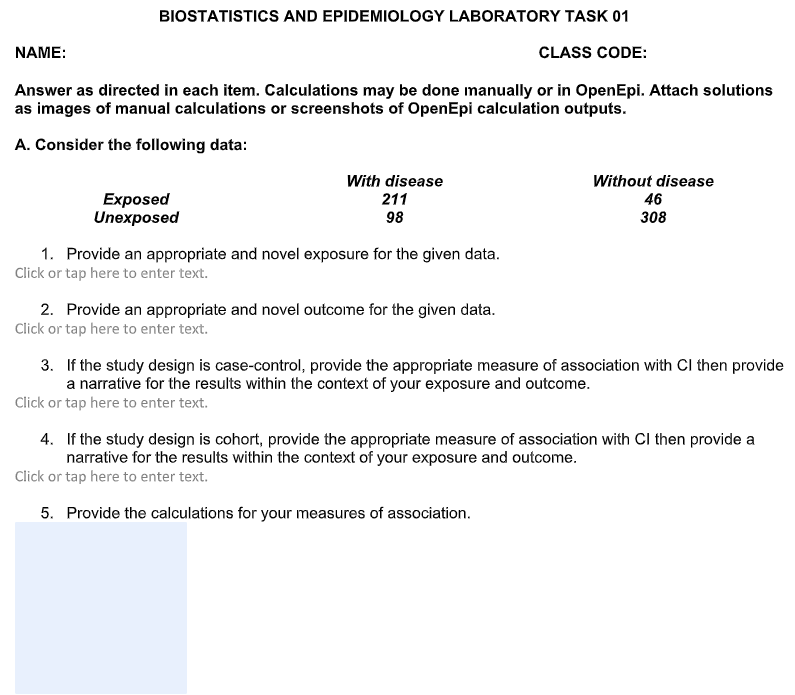
Answer as directed in each item. Calculations may be done manually or in OpenEpi. Attach solutions as images of manual calculations or screenshots of OpenEpi calculation outputs. A. Consider the following data: With disease 211 98 Without disease Exposed Unexposed 46 308 1. Provide an appropriate and novel exposure for the given data. Click or tap here to enter text. 2. Provide an appropriate and novel outcome for the given data. Click or tap here to enter text.
Q: Are Southern and Western states equally prone to fatal lightning strikes? The National Weather…
A: Note: Hi there! Thank you for posting the question. As you have posted multiple questions, as per…
Q: Which of the following statements is incorrect? O a. Ordinal data may be described as qualitative. O…
A: Given the following statements as a. Ordinal data may be described as qualitative b. A categorical…
Q: The Excel file Automobile Options provides data on options ordered together for a particular model…
A: Compute the values of support, confidence and life for Rule – 1: The data represents the options…
Q: According to the document Consumer Expenditures, a publication of the Bureau of Labor Statistics,…
A:
Q: Johnson Filtration, Inc. provides maintenance service for water-filtration systems. Suppose that in…
A: Here, y = Repair time in hours x2 = 0 if the type of repair is mechanical and 1 if the type of…
Q: As part of the UCR program, who publishes statistics annually in Hate Crime Statistics? a. DEA b.…
A: As part of the UCR program, who publishes statistics annually in Hate CrimeStatistics?a. DEAb. SBIc.…
Q: A report stated that based on observing a large number of vehicle occupants, the estimated…
A:
Q: According to the following graphic, "Bent Pins" account for % of PCB Failures. PCB Failures 25 120%…
A: The given graph is,
Q: The table summarizes data on smoking status and perceived risk of smoking and is consistent with…
A: Conditional probability formula : P(A | B) = P(A n B) /P(B)
Q: Are Southern and Western states equally prone to fatal lightning strikes? The National Weather…
A: t test : two sample assuming equal variances southern state fatalities western state…
Q: Based on 1337 data points, the following equation was estimated using OLS From this fragment of data…
A: Hello. Since your question has multiple parts, we will solve first question for you. If you want…
Q: Given are the scores of 10 employees from their 20-point assessment 16 18 10 8 12 15 19 17 16 7…
A:
Q: Classify each of the following as nominal, ordinal, interval, or ratio data. a. The time required…
A: 1. Nominal scale consist of two or more named categories in to which the objects are classified. for…
Q: Listed below are the measured radiation absorption rates (in W/kg) corresponding to 11 cell phones.…
A: From the given data we want to find the 5 number summery and box plot.
Q: Consider the following table: Source SS DF MS Test Statistic Regression 6 745.77 Error…
A: Given Source SS DF MS Test Statistic Regression 6 745.77 Error ? 788.51 Total…
Q: Approximate the measures of center for following GFDT. Data Frequency 60 - 64 2 65 - 69 1 70 - 74 11…
A: Calculate Mean, Median from the following grouped data Class Frequency 60 - 64 2 65 - 69 1…
Q: How long does it take to finish the 1161-mile Iditarod Dog Sled Race from Anchorage to Nome, Alaska?…
A: Explanation: Enter the data in Excel like this, Select the data Go to Insert tab Click on Insert…
Q: Average cheques received per day for KH Connect and WebLink by municipality, 2017 & 2018 Average…
A:
Q: Categorize the type of data. Note: each cell should have an answer Variable Qualitative or…
A: Categorizing the given data:
Q: According to the document Consumer Expenditures, a publication of the Bureau of Labor Statistics,…
A: Solution: Given information: n=25 Sample size μ= 1736 Population mean ∑x=48069x=∑xn=4806925=1922.76…
Q: Use the following table to answer question 5: Running Time School Average Running Time School…
A: Option A is correct
Q: An Electronic store is being questioned by the Head Manager. The Head boss is concerned about this…
A:
Q: A random sample of 40 PGA golfers was taken. The dataset is in the file PGAdriver.xls. A researcher…
A: Note: Hi there! Thank you for posting the question. As your question has more than 3 parts, we have…
Q: Refer to the research analysis output below. Which statement is TRUE? Group of answer choices a. A…
A: p-value = 0.001 T = -3.48
Q: If your grade for your AMDM class is computed the following way: Tests – 60% Final Exam – 20%…
A: Given that your grade for your AMDM class is computed the following way:…
Q: In each case below, give a brief discourse on the consequences that might result from the error…
A: We know that the Null Hypothesis always holds the equality (= , ≥ , ≤ ) . Also Null and Alternate…
Q: City planners believe that larger cities are populated by older residents. To investigate the…
A: Enter the given data into the excel as follows:
Q: Estimate µ, from the following incomplete data : 1 3 4 13 21 37 State the necessary assumption made.
A:
Q: Variable List (a) Using the variables listed in the table above, Describe each variable. (b) State…
A: Ordinal variables are the categorical variables that can only be ranked. For example, you cannot put…
Q: A city council voted to conduct a study on inner city community problems. A nearby univers was…
A: let there be x sociologists and y be the number of research assistants the objective is to minimize…
Q: Suppose a study of speeding violations and drivers who use cell phones produced the following data:…
A: speeding violation no speeding violation total use cell phone 50 295 345 not use cell phone 60…
Q: At OC, students have been surveyed to see whether they attend orientation. The data is as follows:…
A: Woman Men Yes 162 112 No 148…
Q: Which of the following variables has an ordinal scale 1. O Umur mahasiswa/ Student age 2. O…
A: Ordinal data: Nominal data also measure qualitative data but it measure in ordered. Example: High…
Q: The heights of Sydney, Ada, and Ria were 155cm, 158cm and 161cm, respectively. What is the height of…
A: Given that, The heights of Sydney, Ada, and Ria were 155cm, 158cm and 161cm respectively and the…
Q: Done 32 of 37 O FOU FOU O FDU O O F FOU FOU a i…
A: We have to identify type of study used.
Q: Listed below are the measured radiation absorption rates (in W/kg) corresponding to 11 cell phones.…
A: Given: The number of observations, n=11 Observations 1.27 1.11 1.29 0.62 0.57 1.35…
Q: To test for the biodiversity of trees in a tropical rain forest, biologists collected data in the…
A: The curve to be fitted is of the form of y=axbTaking the logarithm on both sides…
Q: Which of the following is not correct about diagram? O a. Requires drawing skill O b. Depict…
A: Not necessarily for diagram is not necessary to draw on plain paper because it may be graph paper.…
Q: Calculate the covariance between the two variables below (3 significant digits in FlINAL answer):…
A: The formula for covariance is given below: CovX,Y=∑x-x¯y-y¯n-1 Observation Funding (x) Outcome…
Q: Which of the following statements is incorrect? O a. Acategorical variable may produce ordinal data.…
A: A categorical variable may produce ordinal data. For example, the difficulty level of a exam paper…
Q: Draw a BOXPLOT, begin with 5 point data summary and end with the Boxplot and the number line with…
A: Note - Since, you have uploaded multiple question, we are providing solution for the question as you…
Q: Use the given data below to compute and interpret the specified meas (Performance Task) 1. Q=. 34,…
A: Given data is31,11,39,54,64,59,47,121,112,102sample size(n)=10
Q: he first five rows of the BIRTHS data set are shown here. For GENDER 1 = male and 0 = female, WEIGHT…
A: Nominal: The variable contains names, labels or categorize particular attributes are being consider…
Q: In an effort to determine which company between Primacom Outsourcing Company and Technica Global…
A: Hypothesis test for two-sample means can be done either by z-test or t-test.
Q: A design that is a very detailed report of the specific features of a particular participant or case…
A: A design that is a very detailed report of the specific features of a particular participant or case…
Q: Approximate the measures of center for following GFDT. Data Frequency 50 -54 55 -59 60-64 10
A: Calculate Mean, Median, Mode from the following grouped data Class Frequency 50 - 54 1 55 -…
Q: City Population City (in millions) Median age Chicago, IL 2.833 31.5 Dallas, TX 1.233 30.5 Houston,…
A:
Q: According to the Centers for Disease Control and Prevention, 9.9% of high school students currently…
A: Claim is that the use of e-cigs at this counseler's school is higher than 0.099.
Q: At Bob’s Bakery, the quality engineer would like to use an X-bar and R chart to track the weights of…
A: The X-bar for the weights of bags of flour is obtained below:Step-by-step procedure to obtain the…
please answer the following question with complete solution
Step by step
Solved in 2 steps
- A report provided an overview of the complaints about airlines received by the Department of Transportation. The table below gives the number of complaints received by type of complaint for the years 2014 and 2015. Type of Complaint 2014 Number ofComplaints Received 2015 Number ofComplaints Received Flight Problems 4,404 5,606 Baggage Handling 1,528 2,050 Reservations, Ticketing, Boarding 1,276 1,807 Customer Service 1,101 1,728 Fares 699 1,300 Other 2,257 2,769 Use the given information to estimate the following probabilities. (Round your answers to three decimal places.) c)the probability that two complaints made in 2015 were both about flight problemsDefine the following terms a. Double-blind experiment and Experiment Data Collection Method : b. All the Levels of measurement:Listed below are the measured radiation absorption rates (in W/kg) corresponding to 11 cell phones. Use the given data to construct a boxplot and identify the 5-number summary. 1.16 1.21 1.39 0.57 0.94 1.23 1.26 0.63 1.46 0.58 1.43 Question content area bottom Part 1 The 5-number summary is enter your response here, enter your response here, enter your response here, enter your response here, and enter your response here, all in W/kg. (Use ascending order. Type integers or decimals. Do not round.)
- Calculate SStotal, SSbetween, and SSwithin for the following set of data: Treatment 1 Treatment 2 Treatment 3 n = 10 n = 10 n = 10 N = 30 T = 10 T = 20 T = 30 G = 60 SS = 27 SS = 16 SS = 23 ∑X2 = 206The Bureau of Labor Statistics gathers data about employment in the United States. A sample is taken to calculate the number of U.S. citizens working in one of several industry sectors over time. Table 11.16 shows the results: Industry Sector 2000 2010 2020 TotalNonagriculture wage and salary 13,243 13,044 15,018 41,305Goods-producing, excluding agriculture 2,457 1,771 1,950 6,178Services-providing 10,786 11,273 13,068 35,127Agriculture, forestry, fishing, and hunting 240 214 201 655Nonagriculture self-employed and unpaid family worker 931 894 972 2,797Secondary wage and salary jobs in agriculture and private householdindustries 14 11 11 36Secondary jobs as a self-employed or unpaid family worker 196 144 152 492Total 27,867 27,351 31,372 86,590 Table 11.16 We want to know if the change in the number of jobs is independent of the change in years. State the null and alternative hypotheses and the degrees of freedom.Consider the partially completed ANOVA summary table below. Complete parts a through d below. Source df SS MS F Regression 1 600 Residual Total 10 1100 a. Complete the remaining entries in the table. Source df SS MS F Regression 1 600 nothing nothing Residual nothing nothing nothing Total 10 1100
- The Behavioral Risk Factor Surveillance System (BRFSS) is an annual telephone survey designed to identify risk factors in the adult population and report emerging health trends. The following table displays the distribution of health status of respondents to this survey (excellent, very good, good, fair, poor) and whether or not they have health insurance. Excellent Very good Good Fair Poor Total No health coverage 459 727 854 385 99 2524 Health coverage 4198 6245 4821 1634 578 17476 Total 4657 6972 5675 2019 667 20000 (a) Why is being in excellent health and having health coverage not mutally exclusive? Please leave a detailed answer and how you found out. (b) If we draw one individual at random, what is the probability that the respondent has excellent health or doesn't have health coverage? Please leave a detailed answer on how you found that answer. (c) What is the probability that a randomly chosen individual has excellent health given that he has health…Is the crime rate in New York different from the crime rate in New Jersey? Independent random samples from region A (cities in New York) and region B (cities in New Jersey) gave the following information about violent crime rate (number of violent crimes per 100,000 population). (Reference: U.S. Department of Justice, Federal Bureau of Investigation.) Region A 436 408 539 489 439 600 402 595 422 434 486 Region B 438 435 428 556 534 470 616 401 478 430 379 415 Use a 10% level of significance to test the claim that there is no difference in the crime rate distributions of the two states. (a) What is the level of significance?State the null and alternate hypotheses. Ho: Distributions are different. H1: Distributions are the same.Ho: Distributions are the same. H1: Distributions are different. Ho: Distributions are the same. H1: Distributions are the same.Ho: Distributions are different. H1: Distributions are different. (b) Compute the sample test statistic. (Use 2 decimal…Calculate SStotal, SSbetween, and SSwithin for the following set of data: Treatment 1 Treatment 2 Treatment 3 n=5 n=5 n=5 N=5 T=10 T=15 T=35 G=60 SS=21 SS=16 SS=23 ΣX2=370
- In the book Business Research Methods (5th ed.), Donald R. Cooper and C. William Emory discuss studying the relationship between on-the-job accidents and smoking. Cooper and Emory describe the study as follows: Suppose a manager implementing a smoke-free workplace policy is interested in whether smoking affects worker accidents. Since the company has complete reports of on-the-job accidents, she draws a sample of names of workers who were involved in accidents during the last year. A similar sample from among workers who had no reported accidents in the last year is drawn. She interviews members of both groups to determine if they are smokers or not. The sample results are given in the following table. On-the-Job Accident Smoker Yes No Row Total Heavy 12 5 17 Moderate 9 10 19 Nonsmoker 13 17 30 Column total 34 32 66 Expected counts are below observed counts Accident No Accident Total Heavy 12 5 17 8.76 8.24…You work for an insurance company and are studying the relationship between types of crashes and the vehicles involved. As part of your study, you randomly select 3589 vehicle crashes and organize the resulting data as shown in the contingency table. At α=0.10, can you conclude that the type of crash depends on the type of vehicle? Complete parts (a) through (d). Vehicle Type of crash Car Pickup Sport utility Single-vehicle 866 323 340 Multiple-vehicle 1145 487 428 Question content area bottom Part 1 (a) Identify the claim and state the null and alternative hypotheses. H0: The type of crash and the type of vehicle are ▼ independent dependent Ha: The type of crash and the type of vehicle are ▼ dependent independent The ▼ alternative hypothesis null hypothesis is the claim. H0: The type of crash and the type of vehicle are Ha: The type of crash and the type of vehicle are Determine the…Mr. Shammed is planning to study the relationship between salary and expenditure of the private sector male employees in Ibri. Which of the following should be the target population of the study? a. All b. Private sector female employees in Ibri c. Private sector male employees in Ibri d. Private sector employees in ibri