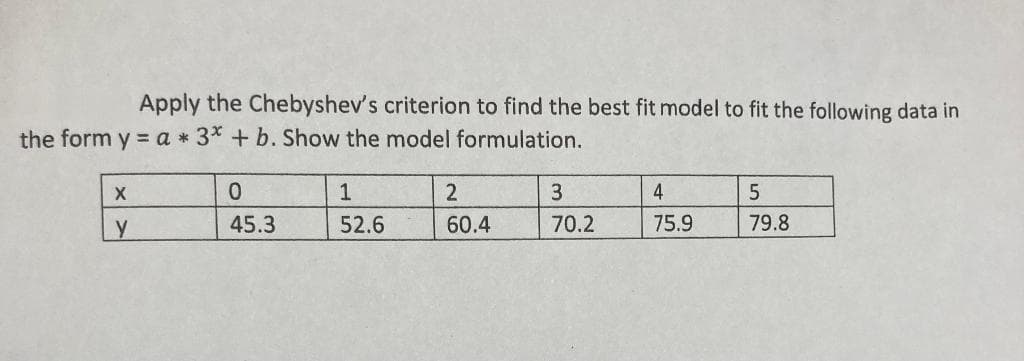
Apply the Chebyshev's criterion to find the best fit model to fit the following data in the form y = a * 3* + b. Show the model formulation. 0. 1 2 3 4 y 45.3 52.6 60.4 70.2 75.9 79.8


Q: Calculate the value of r and test if there is a significant relationship between age of persons and…
A: Solution: X Y (X-X) (Y-Y) (X-X)2 (Y-Y)2 (X-X)(Y-Y) 11 40 -4.5 -4.4 20.25 19.36 19.8 12 42…
Q: Q. 10 (а) Calculate the appropriate measure of dispersion from the following data : less than 35 |…
A: continuing with...frequency distribution......
Q: Consider the following data points: r|-1 0 0 2 2 y-1 0 1 1 2 Find the best-fit line y = a+ Bx for…
A: note : As per our company guidelines we are supposed to answer ?️only the first question. Kindly…
Q: 15. Determine the 5 number summary for this data set of tire pressures(psi). 88 7 36 88 42 18 37…
A: Introduction :- For the given data we have to create 5 number summary. i.e Minimum Q1 Median Q3…
Q: Calculate Karl Pearson's coefficient of skewness of the following data : 25 15 23 40 27 25 23 25 20
A:
Q: The two data sets are dependent. Find d to the near est tenth. X 6.5 8.9 7.5 8.1 6.8 5.7 7) Y 9.1…
A: Solution: 7. From the given information, the data set is
Q: The following sample is collected as a conclusion of an observation: |2 3 47.3 66.7 4 6. 7 9 10 |Y…
A: The following equation is given in the question Now, Enter this data into Excel Taking log of Y…
Q: In the following data, xx is the average number of hours the student spent working on math each week…
A: Here the regression line is given. We have to predict the grade from the number of hours studied. x…
Q: In the following data, x is the average number of hours the student spent working on math each week…
A:
Q: Based on the data shown below, calculate the regression line (show each value to two decimal places)…
A:
Q: Use the table to calculate the 80 % prediction interval for y at zo = 20 3 22 4 23 29 27 29 8. 31
A: Given: x y 3 22 4 23 5 29 6 27 7 29 8 31
Q: . The following sample is collected as a conclusion of an observation: 1 3 4 8. 10 117.1 147.5 224.6…
A: Here we need to fit the given regression model to the data. Now since the regression model is not a…
Q: y 1 3.25 2 3.54 3 3.73 4 3.86 3.97
A: The least square regression technique uses a dataset to determine a function, y=f(x) such that the…
Q: Based on the data shown below, calculate the regression line (each value to at least two decimal…
A:
Q: The following information is obtained from a sample data set. = 12. x = 42, y = 564, xy = 570, = 186…
A:
Q: The following data was taken from experiment. The data can be modeled by the following equation. ya…
A: From the given information, the given model is,…
Q: Consider the following data. 21 6. 12 30 55 10.5 20.4 31.3 38.6 75.9 118.8 (a) Find a linear model.…
A: Given that the data are x 2 5 9 12 30 55 y 10.5 20.4 31.3 38.6 75.9…
Q: Use the second curve fitting criterion to minimize the sum of absolute deviations for the model y =…
A:
Q: In the following data, xx is the average number of hours the student spent working on math each week…
A: A linear regression model corresponds to a linear regression model that minimizes the sum of squared…
Q: In the following data, a is the average number of hours the student spent working on math each week…
A: Given Y = 3.02X + 39.28 Find grade if X = 10
Q: For the data set 39 6 13 4 9 7 14 4 10 7 15 5 11 7 26 5 11 8 86 12 Send data to Excel Part: 0/4 Part…
A: Given data, 3,9,6,13,4,9,7,14,4,10,7,15,5,11,7,26,5,11,8,8,6,12 Sort given data in ascending…
Q: . Use the following data to predict Monthly Rent Monthly Rent Size (Sq Ft) 825 1450 1250 850 1450…
A: a) The regression line is Y=60.94+1.14X.
Q: Based on the data shown below calculate the regression line ( each value to two decimal places)…
A:
Q: With the help of data given in the following table calculate regression line Y'. ΣΧ ΣΥ ΣΧΥ Σχ2 15 25…
A:
Q: On graph paper, draw a scatter plotoftemperature against bowls soldto represent the data using a…
A: There is a negative linear relationship between the temperature and the number of bowls sold.
Q: Use the data and prediction equation given below to calculate the residual when X= 7. Y_hat = 19 +…
A:
Q: In the following data, x is the average number of hours the student spent working on math each week…
A: 1. The given function is a linear function of x (time spent on Maths per week) and y (Marks in…
Q: Before microwave ovens are sold, the manufacturer must check to ensure that the radiation coming…
A: a) Using the given data take the values of 1 to 25 from x axis , values of 1 to 20 on y-axis and…
Q: The following data relate to size of shoes sold at a store during a given week. Find the average…
A: x frequency (f) d =( X - A)/A = (X- 0.8)/0.5 A =8,h= 0.5 f.d 4.5 1 -7 -7 5 2 -6 -12 5.5 4 -5…
Q: The following data are the number of years of full-time education (x) and the annual salary in…
A: The sums are, x y x2 y2 xy 20 35.2 400 1239.04 704 27 24.2 729 585.64 653.4 28 23.5 784…
Q: The following data is given: x 0 2 3 5 6 y 1 1 7 11 20 Question 1 Determine the best (according to…
A: Given data, X Y X*Y X*X 0 1 0 0 2 1 2 4 3 7 21 9 5 11 55 25 6 20 120 36
Q: (b).The following data were obtained in a study of the relationship between the weight and the chest…
A: From given data, X Y X*Y X*X Y*Y 2.75 29.5 81.125 7.5625 870.25 2.15 26.3 56.545 4.6225…
Q: calculate the regression line (each value to at least two decimal places) y = ___ x + ____ x y 1…
A:
Q: Calculate Karl Pearson's Co-efficient of skewness from the following data Number of Students Marks…
A:
Q: Based on the data shown below, calculate the regression line (show each value to two decimal places)…
A: The regression line is Y = a+bX
Q: Based on the data shown below, calculate the regression line (each value to at least two decimal…
A:
Q: Fit a cubic spline to the following data to determine y @x =1.5 2 4 7 10 12 y 20 20 12 7 6. 6.
A:
Q: The population proportion for a certain characteristic is 0.28. In a sample of 100 people, 25 had…
A: From the provided information, Population proportion (p) = 0.28 Sample size (n) = 100 From which 25…
Q: Based on the data shown below, calculate the regression line (each value to two decimal places) y…
A:
Q: 6. Calculate Bowley's coefficient of skewness from the following data: 200 225 250 75 100 125 150…
A:
Q: For this grouped data set: Scores | Frequencies 30-34 | 7 25-29 |…
A:
Q: Based on the data shown below, calculate the regression line (each value to two decimal places) y =…
A: Given x y 3 7.16 4 8.68 5 6.6 6 9.82 7 9.84 8 9.36 9 7.38 10 9.2 11 9.02 12…
Q: Based on the data shown below, calculate the regression line (each value to two decimal places) y =…
A: Solution: The regression equation is obtained by using excel. Procedure: Enter the data in excel.…
Q: The following data pertain to x, the amount of fertil-izer (in pounds) that a farmer applies to his…
A: Given data:
Q: The data below are the termperatures on randomly chosen days during a summer class and the number of…
A: Solution-: Let, X=Temperature and Y=Number of absences We have following table: X Y 72 3 85 7…
Q: The following information is obtained from a sample data set. n = 24, Ex = 108, E y = 1152, xy =…
A: All values are given so directly use the formula and simplify.
Q: Q) Fit the curve of the form y = ab* to the following data, then find the standard deviation. 3 4 5…
A: Given that we need to fit the curve y = abx to the following data. Now applying loge on both sides…
Q: d. Draw the regression line on the scatter diagram using the yp points.e. Find y for x = 50 x 20…
A: Given data x y 20 20 10 20 30 30 40 50 60 60 70 80…
Q: The following information is obtained from a sample data set. = 12, x = 42, y = 564, xy = 570, = 186…
A:
Q: Q) Fit the curve of the form y = ab* to the following data, then find the standard deviation. 3 4 5…
A: x y y2 3 1.8 3.24 4 2.5 6.25 5 3.6 12.96 6 4.7 22.09 7 6.6 43.56 ∑y =19.2∑y2=88.1mean…
Please don't copy


Trending now
This is a popular solution!

Step by step
Solved in 2 steps

- Use the table of values you made in part 4 of the example to find the limiting value of the average rate of change in velocity.A law enforcement organization claims that their radargun is accurate to within 0.5 miles per hour for a courthearing. An independent organization hired to test theaccuracy of the radar gun conducted 12 tests on a projectilemoving at 60 miles per hour. Given the data inthe following table, determine if the radar gun can beused in court. State the hypothesis and base your commentson an appropriate α level.. Two soft drink dispensing machines should dispense 8 oz of your selection into a cup. The table below shows the data Machine 1 9.52 6.41 10.07 5.85 8.15 Machine 2 8.01 7.99 7.95 8.03 8.02 Which is more consistent in dispensing soda base on the measures of dispersion? Show all solutions.
- Consider the following data relating hours spent studying (X) and average grade on course quizzes (Y): X Y 5 6 3 8 4 8 7 10 5 7 6 9 Compute SP (equation below) 420 5 6 17The following table contains data on the temperature and the pressureof a gas in a cylinder. What is the pressure of the gas at T = 520 and T = 750degrees Kelvin? Hint: fit the least square line to this.Temp. (◦K) 483 659 703 643 407 605 640 479 409 783Pres. (atm) 1.84 2.37 2.85 2.52 1.55 2.15 2.35 1.86 1.66 3.16. The following data represent the growth of a population of fruit flies over a 6-weekperiod. Test the following models by plotting an appropriate set of data. Estimate theparameters of the following models.a. P D c1tb. P D aebtt (days) 7 14 21 28 35 42P (number of observed flies) 8 41 133 250 280 297
- The population (in millions) and the violent crime rate (per 1000) were recorded for 10 metropolitan areas. The data are shown in the following table. Do these data provide evidence to reject the null hypothesis that ? = 0 in favor of ? ≠ 0 at ? = .05? (Give your answers correct to three decimal places.) Population 10 2.3 1.4 6 2.7 6 1.9 1.7 2.1 6.7 Crime Rate 12.4 6.7 7.8 7.4 8 7 8.9 9.1 8 7.7 (ii) Calculate the critical region. (smaller value) (larger value)Which of the following population densities are equivalent to a density of 125 people/mi2? There may be more than one correct answer. i. 1 person/0.08 mi2 ii. 100 people/0.8 mi2 iii. 12500 people/12.5 mi2 iv. 1 person/0.008 mi2 v. 1 person/1.25 mi2Given following data set generate dot plot number of text messages sent by 20 students in Mrs. T calculus class 1 3 2 13 32 8 2 6 3 4 1 0 2 2 0 2 1 2 7 2
