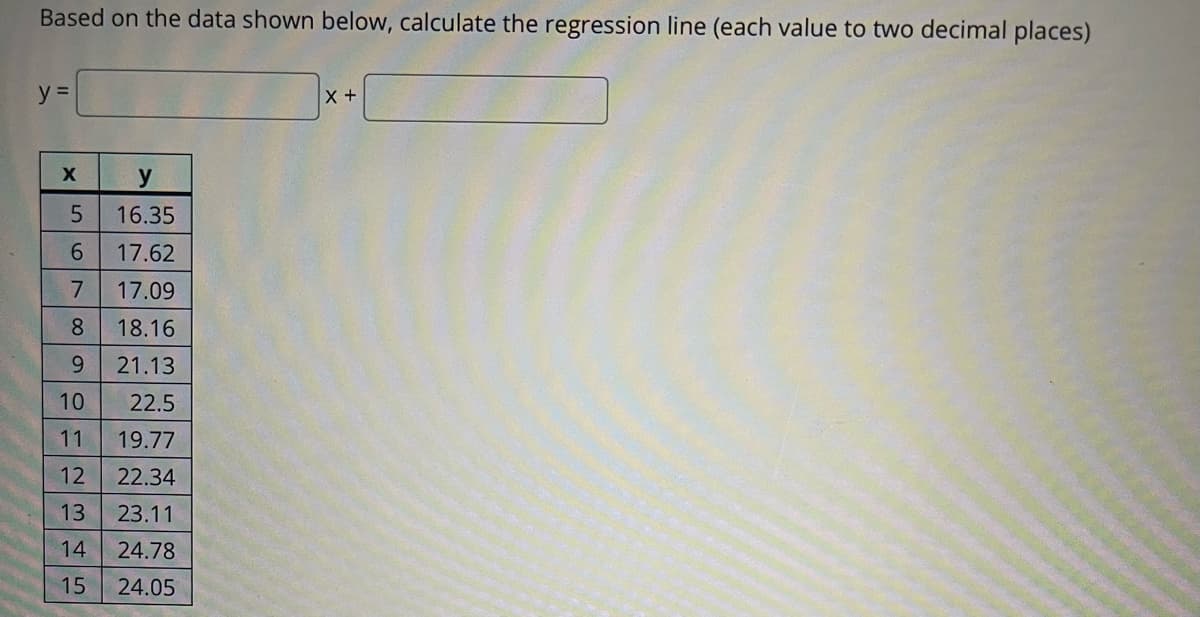
Based on the data shown below, calculate the regression line (each value to two decimal places) y 16.35 6. 17.62 7 17.09 8 18.16 21.13 10 22.5 11 19.77 12 22.34 13 23.11 14 24.78 15 24.05


Q: Based on the data shown below, calculate the regression line (each value to two decimal places) y =…
A: Given that X Y X \cdot YX⋅Y X^2X2 Y^2Y2 5 20.5 102.5 25 420.25 6 21.85 131.1 36…
Q: Based on the data shown below, calculate the regression line (each value to two decimal places) y =…
A:
Q: Based on the data shown below, calculate the regression line (each value to two decimal places) y% =…
A: The required regression equation of Y on X is, y=a+bxwhere,a=y-interceptb=slope of the…
Q: Based on the data shown below, calculate the regression line (each value to two decimal places)…
A: Introduction: Consider that x is the independent variable and y is the dependent variable. The size…
Q: Based on the data shown below, calculate the regression line (each value to two decimal places) y…
A:
Q: Find out the 'b' value of regression from the following data. Y 10 12 12 13 10 11 8. 14
A: Given data, X Y X*Y X*X 10 12 120 100 12 13 156 144 10 11 110 100 8 14 112 64…
Q: Based on the data shown below, calculate the regression line (each value to two decimal places) y =…
A: Given data, X Y X*Y X*X 4 8 32 16 5 8.8 44 25 6 9.4 56.4 36 7 7.5 52.5 49 8 7.5 60 64…
Q: Based on the data shown below, calculate the regression line (each value to two decimal places) y…
A:
Q: Based on the data shown below, calculate the regression line (each value to two decimal places)y = x…
A: Regression: Regression is a technique that is used to determine relationship between two or more…
Q: Based on the data shown below, calculate the regression line (each value to two decimal places) y =…
A: From the provided information, x y 5 11.3 6 12.52 7 11.54 8 12.86…
Q: Based on the data shown below, calculate the regression line (each value to two decimal pla y = y…
A: Answer : y = 0.33714x + 1.45714
Q: Based on the data shown below, calculate the regression line (each value to at least two decimal…
A:
Q: Based on the data shown below, calculate the regression line (each value to two decimal places) y =…
A: Given data x y 1 6.36 2 3.82 3 6.28 4 5.64 5 4.3 6 7.06
Q: Based on the data shown below, calculate the regression line. y 1 44.75 2 43.56 40.27 4 34.98 33.19…
A:
Q: Based on the data shown below, calculate the regression line (each value to two decimal places) y =…
A:
Q: Based on the data shown below, calculate the regression line (each value to two decimal places) y =…
A: Regression Equation: When we want to predict the value of one variable, say y, from the given value…
Q: Use multiple linear regression to fit the following tabulated data: x1 4.5 6. 75 6. 12 x2 8.5 11…
A: For the given data Find Multiple regression equation is =? Standard error of estimate =? Correlation…
Q: Based on the data shown below, calculate the regression line (each value to two decimal p 5 6 23.69…
A: From given data, X Y X*Y X*X 5 22 110 25 6 23.69 142.14 36 7 18.68 130.76 49 8 21.17…
Q: Based on the data shown below, calculate the regression line (each value to at least two decimal…
A:
Q: Based on the data below, calculate the regression line(each value to at least two decimal places) X…
A:
Q: Fit the following data using Linear Regression and determine the total standard deviation, the…
A: Given information: The data represents the values of the variables x and f(x).
Q: Based on the data shown below, calculate the regression line (each value to two decimal places)
A: Given : x y 5 16.61 6 14.38 7 14.45 8 16.02 9 14.99 10 14.36 11 15.63 12 14.2
Q: ed on the data shown below, calculate the regression line (each value to two decimal places) y = x…
A: The table that shows the necessary calculations is depicted as follows: X Y X*Y X2 Y2 1…
Q: Based on the data shown below, calculate the regression line Y= ? X + ? X Y…
A: We have given that , The values of X variable , And the values of Y variable. Shown in step 2 as…
Q: Based on the data shown below, calculate the regression line (each value to at least two decimal…
A:
Q: Based on the data shown below, calculate the regression line (each value to at least two decimal…
A: Enter the given data into the excel as follows:
Q: Based on the data shown below, calculate the regression line (each value to two decimal places) y =…
A: Given: The Given data Table:
Q: Based on the data shown below, calculate the regression line (each value to two decimal places) y =…
A:
Q: Based on the data shown below, calculate the regression line (each value to two decimal places) y%3D…
A:
Q: Find the two lines of regression from the following data Age of husband Age of wife 25 18 22 28 20…
A: Given data is, Age of husband Age of wife 25 18 22 15 28 20 26 17 35 22 20 14 22…
Q: Based on the data shown below, calculate the regression line (each value to two decimal places) y =…
A: Given observation and calculation is shown below x y x2 y2 xy 5 8.85 25 78.3225 44.25 6 8.66…
Q: Based on the data shown below, calculate the regression line (each value to at least two decimal…
A:
Q: Based on the data shown below, calculate the regression line (each value to two decimal places) y =…
A: From given data, X Y X*Y X*X 1 7.33 7.33 1 2 6.82 13.64 4 3 6.41 19.23 9 4 4.1 16.4 16…
Q: Based on the data shown below, calculate the regression line (each value to two decimal places) y =…
A:
Q: Based on the data shown below, calculate the regression line (each value to two decimal places) y =…
A: Based on the data shown below, to calculate the regression line. x y 2 4.85 3 7.3 4 3.55…
Q: Based on the data shown below, calculate the regression line (each value to two decimal places)y =…
A:
Q: Based on the data shown below, calculate the regression line (each value to two decimal places) 2…
A:
Q: Based on the data shown below, calculate the regression line (each value to at least two decimal…
A: Given data; x y x^2 y^2 x⋅y 4 17.56 16 308.3536 70.24 5 19.25 25 370.5625 96.25 6 22.04 36…
Q: Based on the data shown below, calculate the regression line. y 5.55 6 6.92 7 7.29 8 9.96 9 10.33 10…
A: Regression Equation: When we want to predict the value of one variable, say Y, from the given value…
Q: Based on the data shown below, calculate the regression line (each value to two decimal places) Find…
A:
Q: From the following data of the age of husbands and age of wives determine the two regression lines…
A:
Q: Based on the data shown below, calculate the regression line (each value to at least two decimal…
A:
Q: Based on the data shown below, calculate the regression line. y 21.13 5 21.96 7 20.29 8 19.92 9…
A: Given data : X Y 5 21.13 6 21.96 7 20.29 8 19.92 9 17.55 10 18.78 11 17.11 12…
Q: Based on the data shown below, calculate the regression line (each value to two decimal places) y =…
A: Solution: x y x^2 y^2 x⋅y 3 9.21 9 84.8241 27.63 4 8.68 16 75.3424 34.72 5 13.05 25…
Q: Run a regression analysis on the following data set, where y is the final grade in a math class and…
A: Linear regression: The linear regression equation for a data set x, y is y=mx+c, where…
Q: Based on the data shown below, calculate the regression line (each value to at least two decimal…
A: Given data are x y 2 25.87 3 24.06 4 22.45 5 21.84 6 22.93…
Q: Based on the data shown below, calculate the regression line (each value to two decimal places) y =…
A: The following data has been given: x y 3 18.66 4 20.18 5 21.4 6 22.22 7 21.44 8 23.56…
Q: Based on the data shown below, calculate the regression line (each value to two decimal places) y =…
A: Solution: The given data is
Q: The value of PRESS for five different regression models are A = 42.3, B = 47.4, C = 51.5, D =40.6,…
A: The expected square residual error sum (PRESS) statistic is a method of cross-validation used in…
Q: Based on the data shown below, calculate the regression line (show each value to two decimal places)…
A:

Step by step
Solved in 3 steps with 3 images

- Based on the results of the regression, what would be the mose likely conclusion?BASED ON THIS DATA, what does the r^2 values tell you? and the linear regression line is the information statistically significant?Suppose you obtain the following regression model, E[y]=67+75*x. What is the impact of a 92 unit change of x on the expected value of y?
- Based on the data shown below, calculate the regression line (each value to at least two decimal places)y = ____x + ______ x y 1 0.21 2 0.62 3 4.13 4 2.24 5 4.25 6 1.06which of the following regressions represents the strongest negative linear relationship between x and y? (Attached in picture provided)I see that you ran a correlation for Pearson's r, can you run a linear regression?
- Use the sample linear regression line Y^=2+3X for the data points below to answer the following questions. X 0 3 7 10 Y 5 5 27 31 1) What is the fitted value when X2=3? 2) What is the regression residual when X2=3?For the simple regression equation (a), conduct an individual significance tests at the 5% significance level to determine if SQFT is a significant predictor of Price. (Check photo for data)Suppose you obtain the following regression model, E[y]=91+79*x1 +20*x1*x2. What is the impact of a 39 unit change of x1 on the expected value of y when x2 is at its mean of 40?
- Given the partial results from a linear regression model below, a sample size of 504, and ɑ=0.05, What is the F-Statistic for the overall model? Is it statistically significant? What is the R2 for the regression model above?Using the regression line attached. Based on only the above plot, one can conclude: a) height causes an increase in weight b) weight causes an increase in height c) taller people are more likely to weigh more than shorter people, at least in the sample on which this data is based d) a statistically significant predictive relationship between height and weight e) c and dIn a regression context, under what situation is the predicted value for Y equal to the mean of Y?