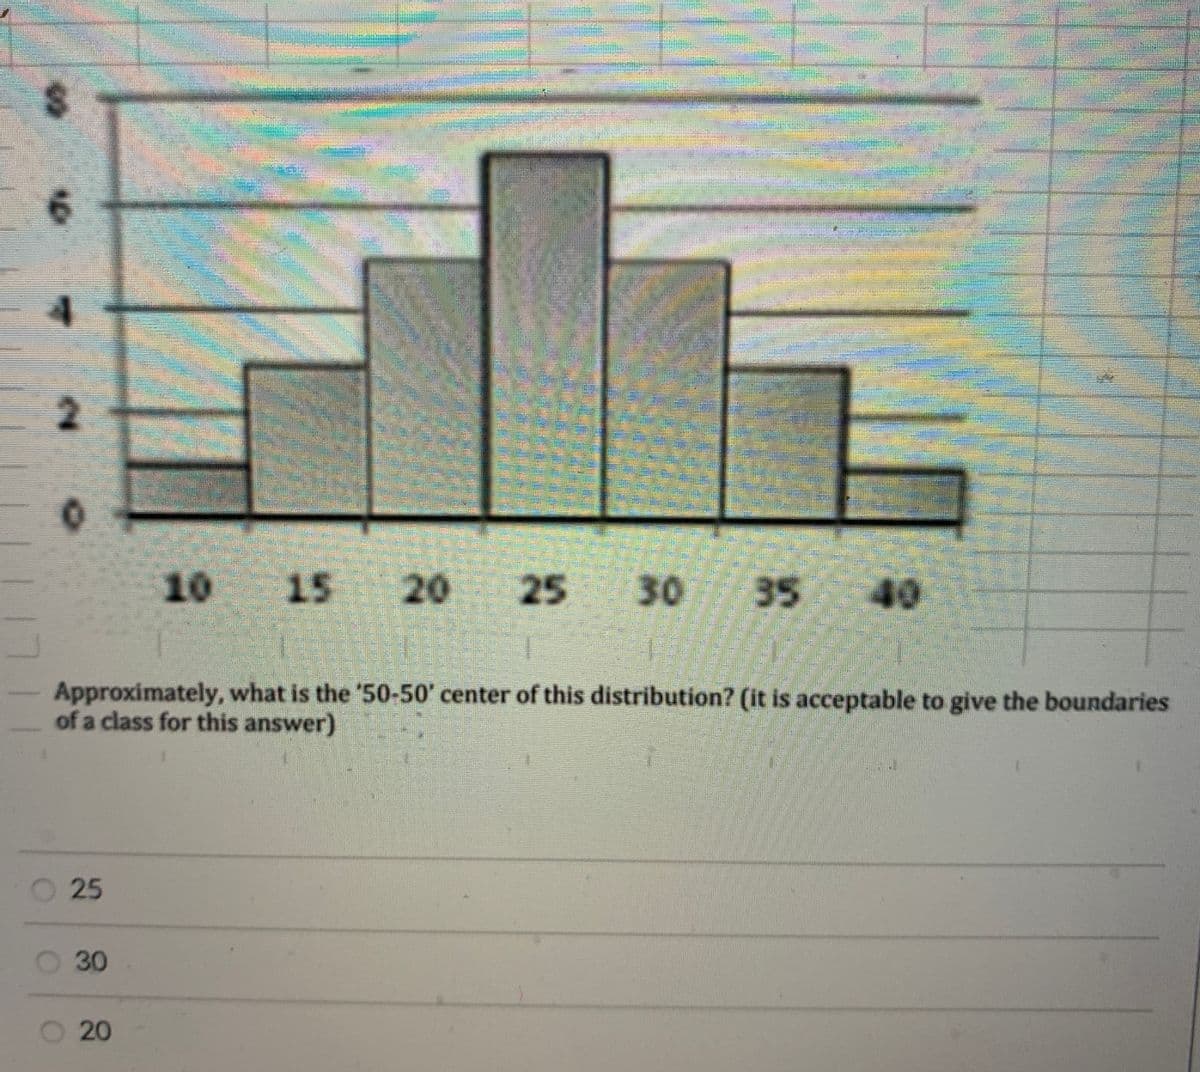
Approximately, what is the '50-50' center of this distribution? (it is acceptable to give the boundaries of a class for this answer)
Q: 3. An extensive study of the cost of health care in the United States presented data showing t the…
A:
Q: Refer to Exhibit 1. The mean square between treatments is O 16350 8750 O 475 O 2916.67
A:
Q: If an applicant is randomly selected, find the probability that the applicant's rating will be…
A: Let X denotes the applicant's ratings. Given that X follows N(mean = 200, SD = 50), then Z = (X -…
Q: 1. Suppose we toss two dice. We will make a table of the probabilities for the sum of the dice. The…
A: In question, If we toss two dice then total outcomes are, S = {(1, 1) (1, 2) (1, 3) (1, 4) (1, 5)…
Q: A farmer claims that less than 5% of peaches produced at her farm are defective. A sample of 400…
A:
Q: ne bo whisker plots below (sometimes called boxplots) summarize the test scores for each class. Use…
A: As per our guidelines we are suppose to answer only one questionGiven Box-and-whisker plots are
Q: Are freshmen psychology majors less likely to change their major before they graduate compared to…
A: Consider that p1, p2 is the true proportions of freshmen psychology majors and freshmen business…
Q: a) Find the probability that one randomly chosen score is less than 1462. P(X < 1462) = b) Find the…
A: Let X denote the SAT scores. Given that X follows N(mean = 1473, SD = 64), then Z = (X - mean)/SD…
Q: Compute the linear correlation coefficient between the two variables and determine whether a linear…
A: Solution: Correlation coefficient is given by, r=∑XY-nX¯ Y∑X2-nX¯2∑Y2-nY¯2 When the value of r is…
Q: According to the National Institute on Alcohol Abuse and Alcoholism (NIAAA) and the National…
A:
Q: Y 30 ΨΥ Ỉ2 2 47 13 23 24 με χ ΕΙΝΑΙ Fino η Exy. ἐκ ἔγ In ex² - (Ex)^ in [y- (fy) th nexy- έχτι…
A: Given information: X Y X^2 Y^2 XY 27 30 729 900 810 44 19 1936 361 836 32 24 1024 576 768…
Q: Here are the summary statistics for randomly selected weights of newborn girls: n =247, x= 32.2 hg,…
A: What is the confidence interval for the population mean u ? _ hg < u< hg _ (round to one…
Q: What is the probability that the next person surveyed is very prepared?
A: It is given that Frequency for Very prepared = 247 Total = 247+982+546+341+76 = 2192
Q: 1. [from old exam] Family background affects many economic decisions, including investment in edu-…
A: Solution: From the given information, the regression equation is
Q: Find the complement of each of the given probabilities
A: Given: Probabilities ,p(A)=4%, P(~A) = 1% , P(A|B) = 99%, P(A|~B) = 43%, P(~A|~B) = 97% Then to…
Q: What type of relationship exists between the two variables x and y in the scatter plot? A.Positive…
A: What type of relationship exists between the two variables x and y in the scatter plot?
Q: Which graph shows a negative correlation
A: Identify the graph that determines the negative correlation between the two variables. The graph…
Q: Suppose that prices of a certain model of new homes are normally distributed with a mean of…
A:
Q: What is the symbol for the residual? Op O a OR² Ορ Or Op ов Ομ ΟΧ Os² S 00² None of the above / does…
A: Correct symbol for residual is e hence answer is none of above / does not have a symbol. In…
Q: 7. If the probability of an individual success is 0.3, which of the following expressions represents…
A:
Q: Consider the following statements: I. Multicollinearity is present when there is a high degree of…
A: Given: y-hat = 135 + 6x + errors. height is increased by 1 inch, and the weight increases by 6…
Q: Consider using a z test to test Ho: p = 0.2. Determine the P-value in each of the following…
A: a) Consider that p is the true population proportion.
Q: onsider a scenario where a Type I error is more severe than a Type II error. Pick the most…
A: Given that Based on the given scenario
Q: Given that the mean for a data set is 24.8 and the standard deviation is 2.3, find the z-score of…
A: It ia given that Mean = 24.8 SD = 2.3 Value X = 27
Q: For a randomly selected classroom, the probability that a student plays piano is 0.34; the…
A: We have given that, Probability of student plays piano P(A) = 0.34, Probability of student plays…
Q: Example 12.11 Two salesmen, A and B, are employed by a company. Recently, it conducted a sample…
A:
Q: 9.33 Une hundred car stereos are inspected as they come off the production line and number of…
A:
Q: 5. A two-tailed test with 1% level of significance has t-computed value inoystlibont of -1.405 with…
A:
Q: What is the symbol for the residual?
A: In this case, we need to identify the correct option for the given statement.
Q: Crossover trial: A crossover trial is a type of experiment used to compare two drugs. Subjects take…
A: Given n=7 Alpha=0.01
Q: The table contains data on the admission price (in dollars) for one-day tickets to 10 theme parks in…
A: Given data is 55,61,42,44,28,48,64,44,40,42sample size(n)=10
Q: Belief in Haunted Places A random sample of 280 college students were asked if they believed that…
A: Answer below
Q: A. One-Sample Test Due to grade deflation in which professor have been giving too many failing…
A: The claim is that professor must pass at least 30% his students.
Q: The lowest level of significance to reject the null hypothesis of no linear association between…
A: Rejection rule: Reject the null hypothesis if the p-value is less than the level of significance.
Q: ind the following A.CRITICAL VALUE B.MARGIN OF ERROR C.LOWER LIMIT D.UPPER LIMIT E.SOLUTION SET…
A: Given that : Sample mean = 185 Sample size (n) = 150 s = 6 By using the confidence interval formula…
Q: An engineer wants to determine how the weight of a car, x, affects gas mileage, y. The following…
A: For the given data find the regression equation and interpret
Q: A given distribution has a population mean, u, of 132 and a population standard deviation, σ, of 14.…
A:
Q: What does the shaded (blue) region show? Shade in the regions for the (i) significance level (ii)…
A: Note: In case of multiple questions, answer to first question will be provided. As Question 1 is…
Q: The mean value of land and buildings per acre from a sample of farms is $1700, with a standard…
A:
Q: Q.4 (a) Define random Poisson points (RPPs), and prove from first principles that their number in a…
A:
Q: Find the slope from the line of best fit y = 7-¾x₁ 31 - 0 -3 O MN
A:
Q: Heller Manufacturing has two production facilities that manufacture baseball gloves. Production…
A:
Q: (a) Set up the null and alternative hypotheses for deciding whether more than half of American…
A: Z statistics for one proportion use to test the proportion
Q: 4(b). What is the probability that the sample proportion of voters who will favor Michael will be…
A:
Q: that we flip a coin twice and it comes up. HH. standard Bayesian information processor: i) What is…
A: *Answer:
Q: Test the claim that the mean GPA of night students is significantly different than 2.8 at the 0.05…
A: Given,sample size(n)=75sample mean(x¯)=2.84standard deviation(s)=0.05α=0.05H0:μ=2.8H1:μ≠2.8 degrees…
Q: L4Q1.How do you classify the following scatter plot? A.No correlation B.Strong positive correlation…
A: From the above data We are given that the scatter diagram And from the given scatter diagram we can…
Q: An article in the Journal of the American Ceramic Society, "Rapid Hot-Pressing of Ultrafine PSZ…
A: a) Excel Procedure: Enter X and Y in Excel>Data>Data Analysis> ‘Regression’>Select Y…
Q: Example 9.1 Let us take X as the number of heads obtained in three tosses of a fair coin. We are…
A:
Q: What is the standardized test statistic for the significance test the school administrator wants to…
A: It is given that Sample size n = 10 Sample mean M = 27.5 Sample SD s = 3.85 Population mean = 25
Trending now
This is a popular solution!
Step by step
Solved in 2 steps