Arci, a food technology student, conducted a taste experiment to investigate whether the teenagers’ preference for soda would change if it was colored blue. The variable of interest is ____________. which is in the _______________ level of measurement. The random sample of students was collected as ________________ samples. The appropriate test procedure to analyze the given data is the ________________. Moreover, the appropriate set of hypotheses to test the given objective is Ho: ______________. and Ha: _______________. The test yield a p-value equal to _________________. This indicates that there is Choose an item. evidence to say that ______
Arci, a food technology student, conducted a taste experiment to investigate whether the teenagers’ preference for soda would change if it was colored blue. The variable of interest is ____________. which is in the _______________ level of measurement. The random sample of students was collected as ________________ samples. The appropriate test procedure to analyze the given data is the ________________. Moreover, the appropriate set of hypotheses to test the given objective is Ho: ______________. and Ha: _______________. The test yield a p-value equal to _________________. This indicates that there is Choose an item. evidence to say that ______

Trigonometry (MindTap Course List)
10th Edition
ISBN:9781337278461
Author:Ron Larson
Publisher:Ron Larson
Chapter6: Topics In Analytic Geometry
Section6.4: Hyperbolas
Problem 5ECP: Repeat Example 5 when microphone A receives the sound 4 seconds before microphone B.

Related questions
Question
Arci, a food technology student, conducted a taste experiment to investigate whether the teenagers’ preference for soda would change if it was colored blue. The variable of interest is ____________. which is in the _______________ level of measurement. The random sample of students was collected as ________________ samples.
The appropriate test procedure to analyze the given data is the ________________. Moreover, the appropriate set of hypotheses to test the given objective is Ho: ______________. and Ha: _______________. The test yield a p-value equal to _________________. This indicates that there is Choose an item. evidence to say that _____________________..
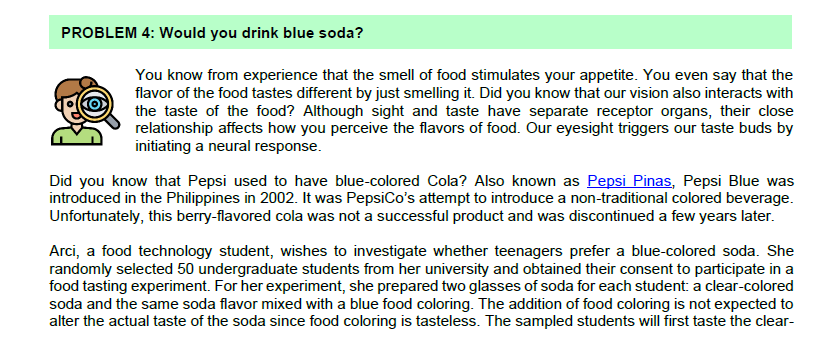
Transcribed Image Text:PROBLEM 4: Would you drink blue soda?
You know from experience that the smell of food stimulates your appetite. You even say that the
flavor of the food tastes different by just smelling it. Did you know that our vision also interacts with
the taste of the food? Although sight and taste have separate receptor organs, their close
relationship affects how you perceive the flavors of food. Our eyesight triggers our taste buds by
initiating a neural response.
Did you know that Pepsi used to have blue-colored Cola? Also known as Pepsi Pinas, Pepsi Blue was
introduced in the Philippines in 2002. It was PepsiCo's attempt to introduce a non-traditional colored beverage.
Unfortunately, this berry-flavored cola was not a successful product and was discontinued a few years later.
Arci, a food technology student, wishes to investigate whether teenagers prefer a blue-colored soda. She
randomly selected 50 undergraduate students from her university and obtained their consent to participate in a
food tasting experiment. For her experiment, she prepared two glasses of soda for each student: a clear-colored
soda and the same soda flavor mixed with a blue food coloring. The addition of food coloring is not expected to
alter the actual taste of the soda since food coloring is tasteless. The sampled students will first taste the clear-
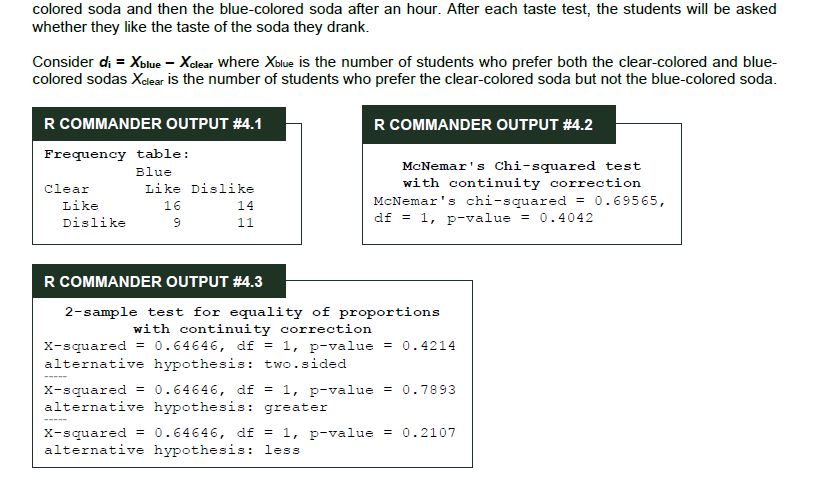
Transcribed Image Text:colored soda and then the blue-colored soda after an hour. After each taste test, the students will be asked
whether they like the taste of the soda they drank.
Consider di = Xblue - Xdlear where Xblue is the number of students who prefer both the clear-colored and blue-
colored sodas Xclear is the number of students who prefer the clear-colored soda but not the blue-colored soda.
R COMMANDER OUTPUT #4.1
R COMMANDER OUTPUT #4.2
Frequency table:
McNemar's Chi-squared test
with continuity correction
McNemar's chi-squared = 0.69565,
df = 1, p-value = 0.4042
Blue
Clear
Like Dislike
Like
16
14
Dislike
11
R COMMANDER OUTPUT #4.3
2-sample test for equality of proportions
with continuity correction
x-squared = 0.64646, df = 1, p-value = 0.4214
alternative hypothesis: two.sided
x-squared = 0.64646, df = 1, p-value = 0.7893
alternative hypothesis: greater
x-squared = 0.64646, df = 1, p-value = 0.2107
alternative hypothesis: less
Expert Solution
This question has been solved!
Explore an expertly crafted, step-by-step solution for a thorough understanding of key concepts.

This is a popular solution!

Trending now
This is a popular solution!

Step by step
Solved in 2 steps

Recommended textbooks for you
Trigonometry (MindTap Course List)
Trigonometry
ISBN:
9781337278461
Author:
Ron Larson
Publisher:
Cengage Learning

Linear Algebra: A Modern Introduction
Algebra
ISBN:
9781285463247
Author:
David Poole
Publisher:
Cengage Learning
Trigonometry (MindTap Course List)
Trigonometry
ISBN:
9781337278461
Author:
Ron Larson
Publisher:
Cengage Learning
Linear Algebra: A Modern Introduction
Algebra
ISBN:
9781285463247
Author:
David Poole
Publisher:
Cengage Learning